Deprecated since 0.13
This article is deprecated. The described features are no longer available in current releases.
Reactive systems are often designed with the help of high-level modeling tools, where real-time is not part of the model abstraction. This separation of concerns is valuable on the one hand, as it facilitates formal reasoning and determinism, as leveraged for example by the synchronous languages - also SCCharts. On the other hand, from the viewpoint of the modeler it limits the possibility to control and reason about the execution time of the modeled system.
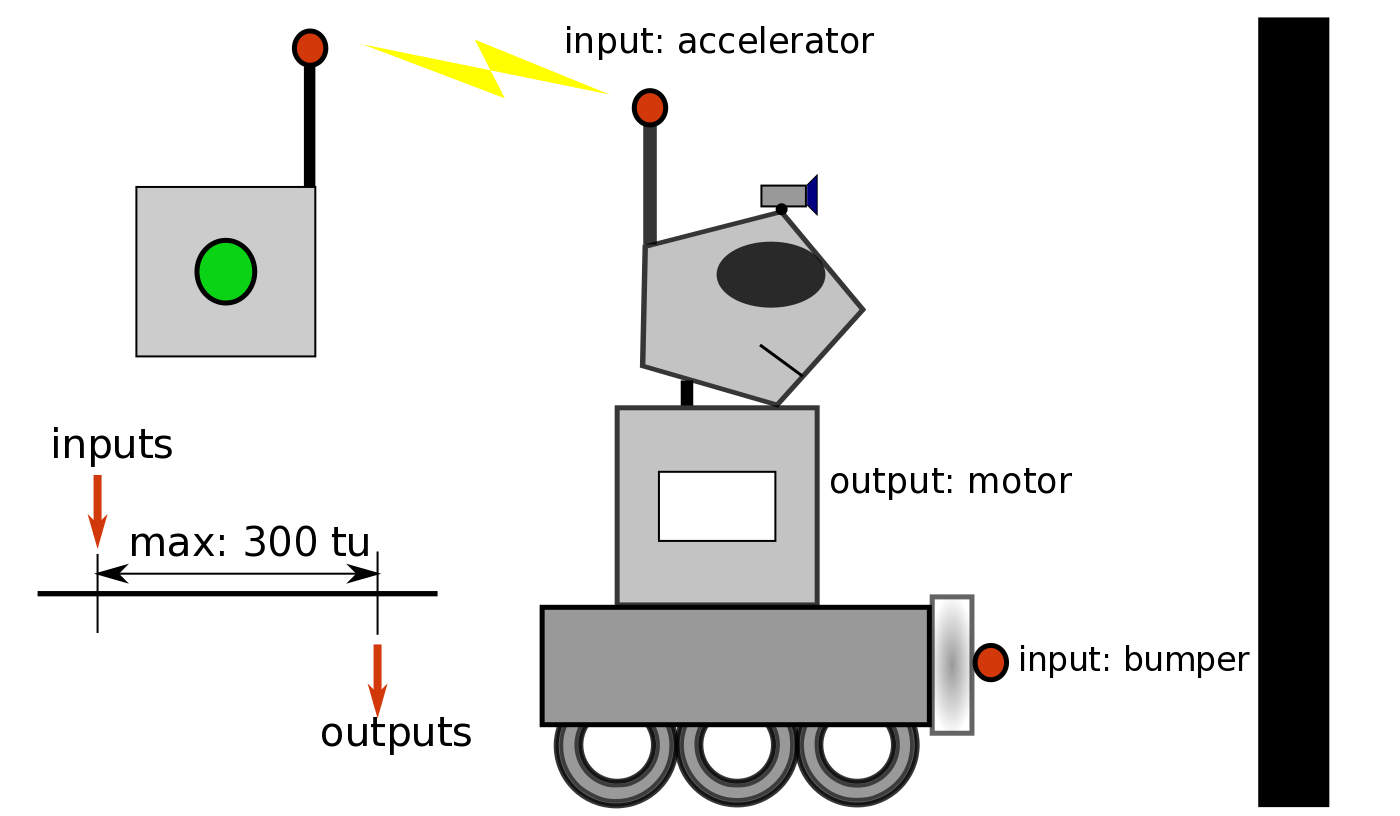
Very often, the specification for the system under development encompasses a limit on how long it may take the system to read its inputs and compute and feedback its outputs. Imagine for example a simple robot that drives as long as the accelerator button of the remote control is pressed. Assume that the robot has a bumper sensor input, which represents the detection of contact with an obstacle. Assume that as soon as such a contact happens, the robot has to stop in 300 time units (let's stay abstract as to the representation of time at the moment), because otherwise its crushing zone will be consumed and serious damage might occur. Driving and stopping are represented by the boolean "motor" output, which is set to true, when the robot is to drive and false when it must stop. Additionally, our the robot can write different log files and take images with its camera. For those functionalities the modeler may refer to host code library functions errorLog(), writeLog() and getImage().
The following picture shows an example representation of this model in SCCharts:
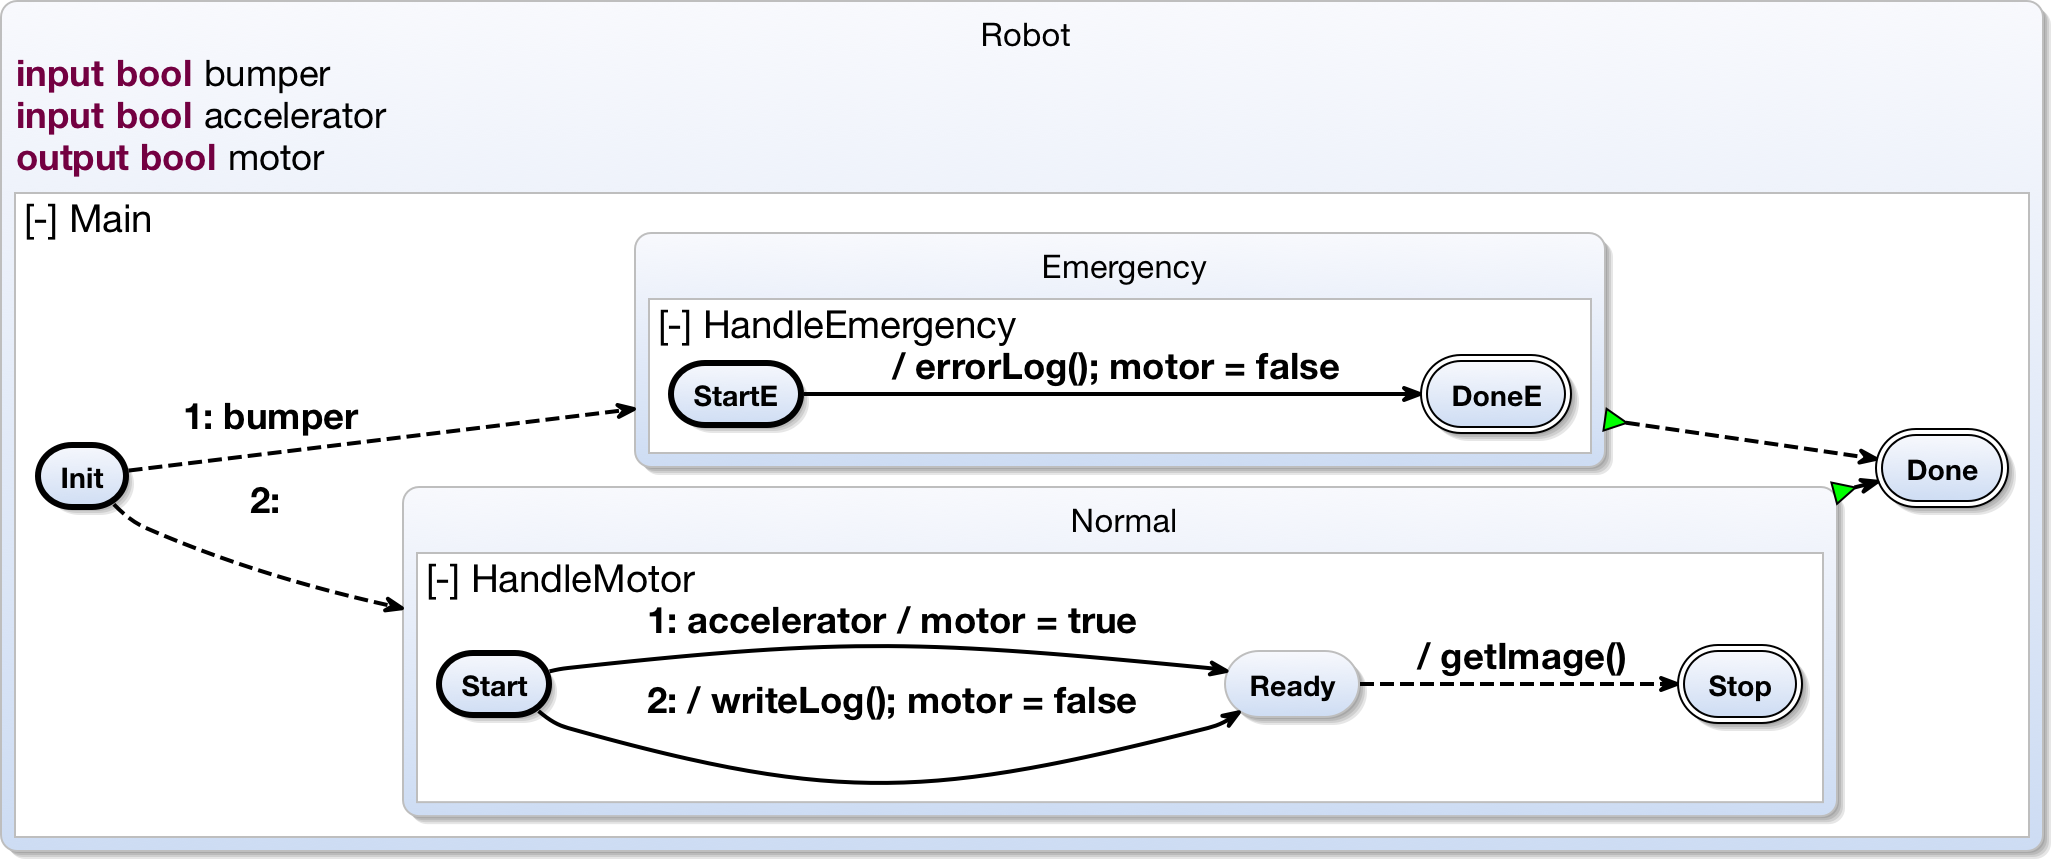
There are three regions, called Main, HandleEmergency and HandleMotor. Depending on whether the bumper sensor input is true or not, we enter one of the two inner regions. In the case the bumper sensor was activated, the HandleEmergency region will be executed, in the other case HandleMotor is active. In the collision case, the robot writes an error log file, which is represented by a host code call to errorLog(). Also the motor output is set to false. In the other case the robot drives, given its accelerator button is pressed, which is represented by the accelerator input and then it takes a picture.
What we cannot detect in this picture is any information on whether this implementation is correct as to the timing specification. Does the worst tick of this model take longer than 300 time units? To answer this question the modeler would have to generate code from the model and invoke a timing analysis tool on the code. The analysis tool would return a (single) time value. If this time value is too high, the modeler has to return to the modeling process and go on. Additionally there is no information as to where the most time consuming parts of the model are to be found. To relieve the modeler of such a tedious process, we developed the Kieler Interactive Timing Analysis (KITA). Its central idea is to interactively feed back timing information to the image of the model. This can not only be done for the model in general but more detailed for model parts. Additionally we highlight the costly regions of the model with different shades of red, according to their contribution to the overall worst case execution time for one pass of the tick function for the SCChart:
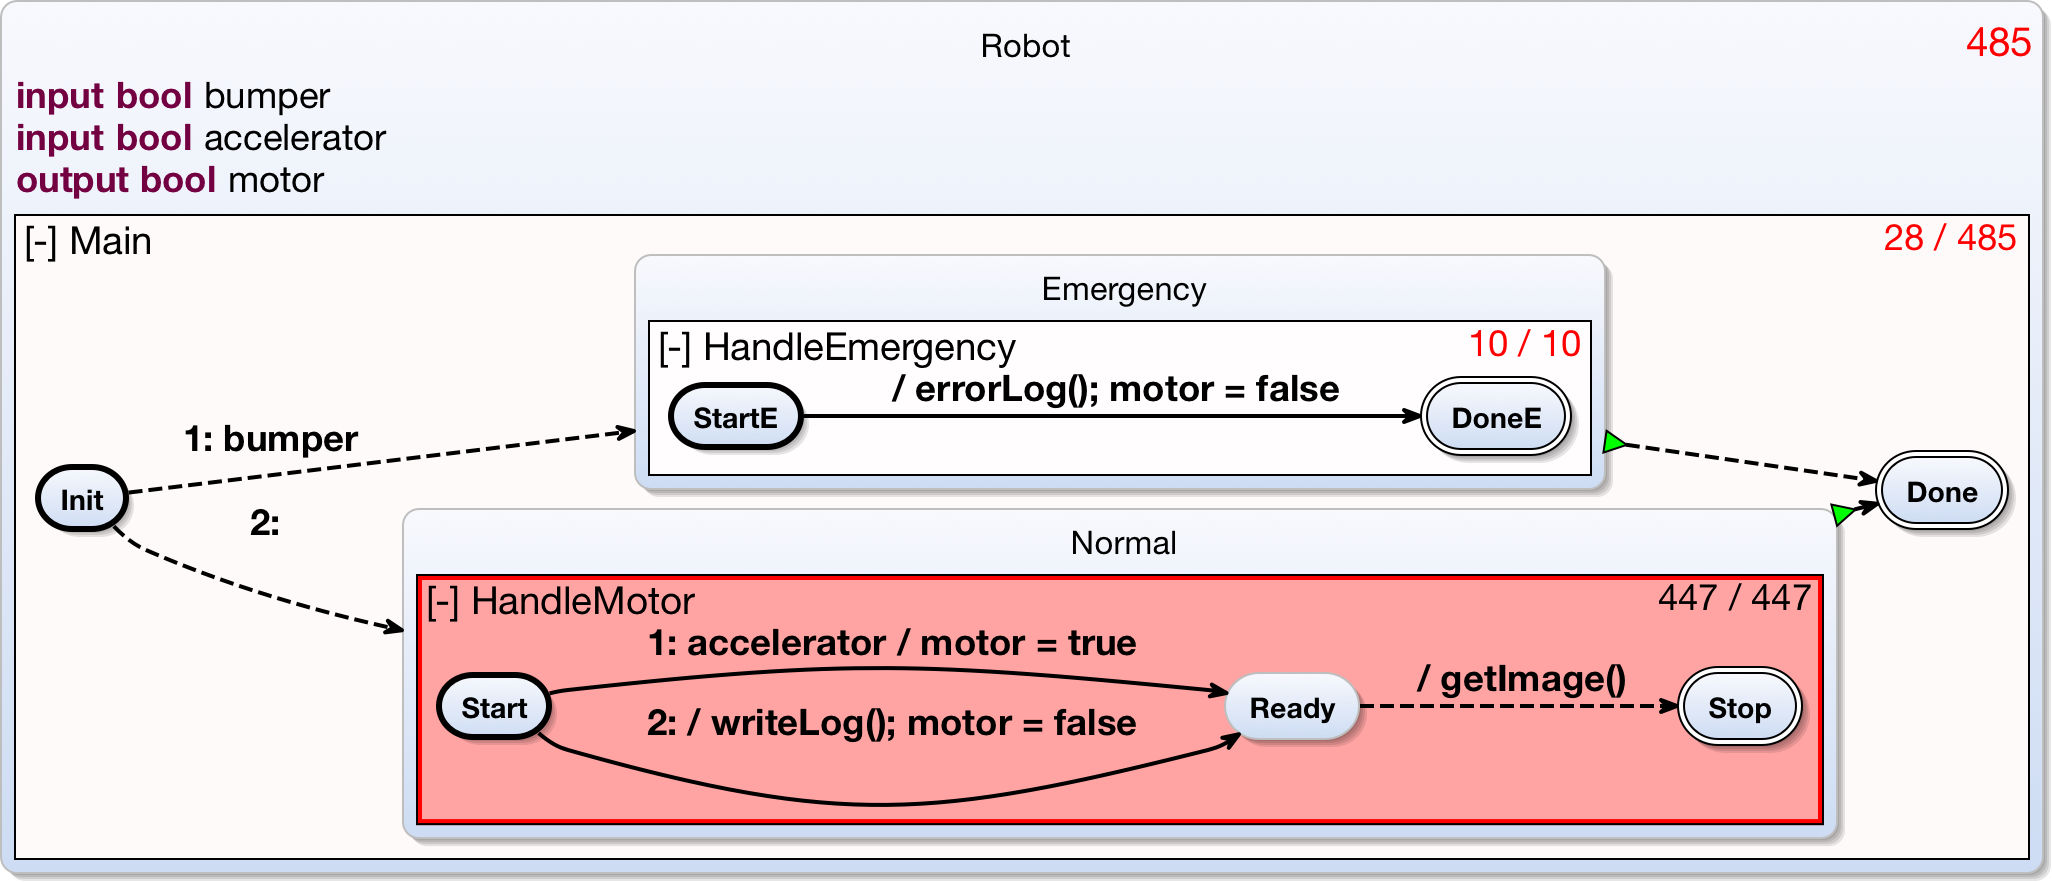
The time values shown in the right upper corners of the regions denote the region's share of the overall worst case execution time of the model for a single tick. The legend is <flat exectution time value>/<deep execution time value> in which the flat timing value does not take child regions (regions that are contained in this region) into account, whereas the deep timing value inclues their share of the overall execution time. Now the modeler can see that the specification of 300 time units is violated. Additionally the hotspot-highlighting points to the most costly part of the model, which is the region HandleMotor, whose time value alone exceeds the timing specification. The model might now be revised to another version:
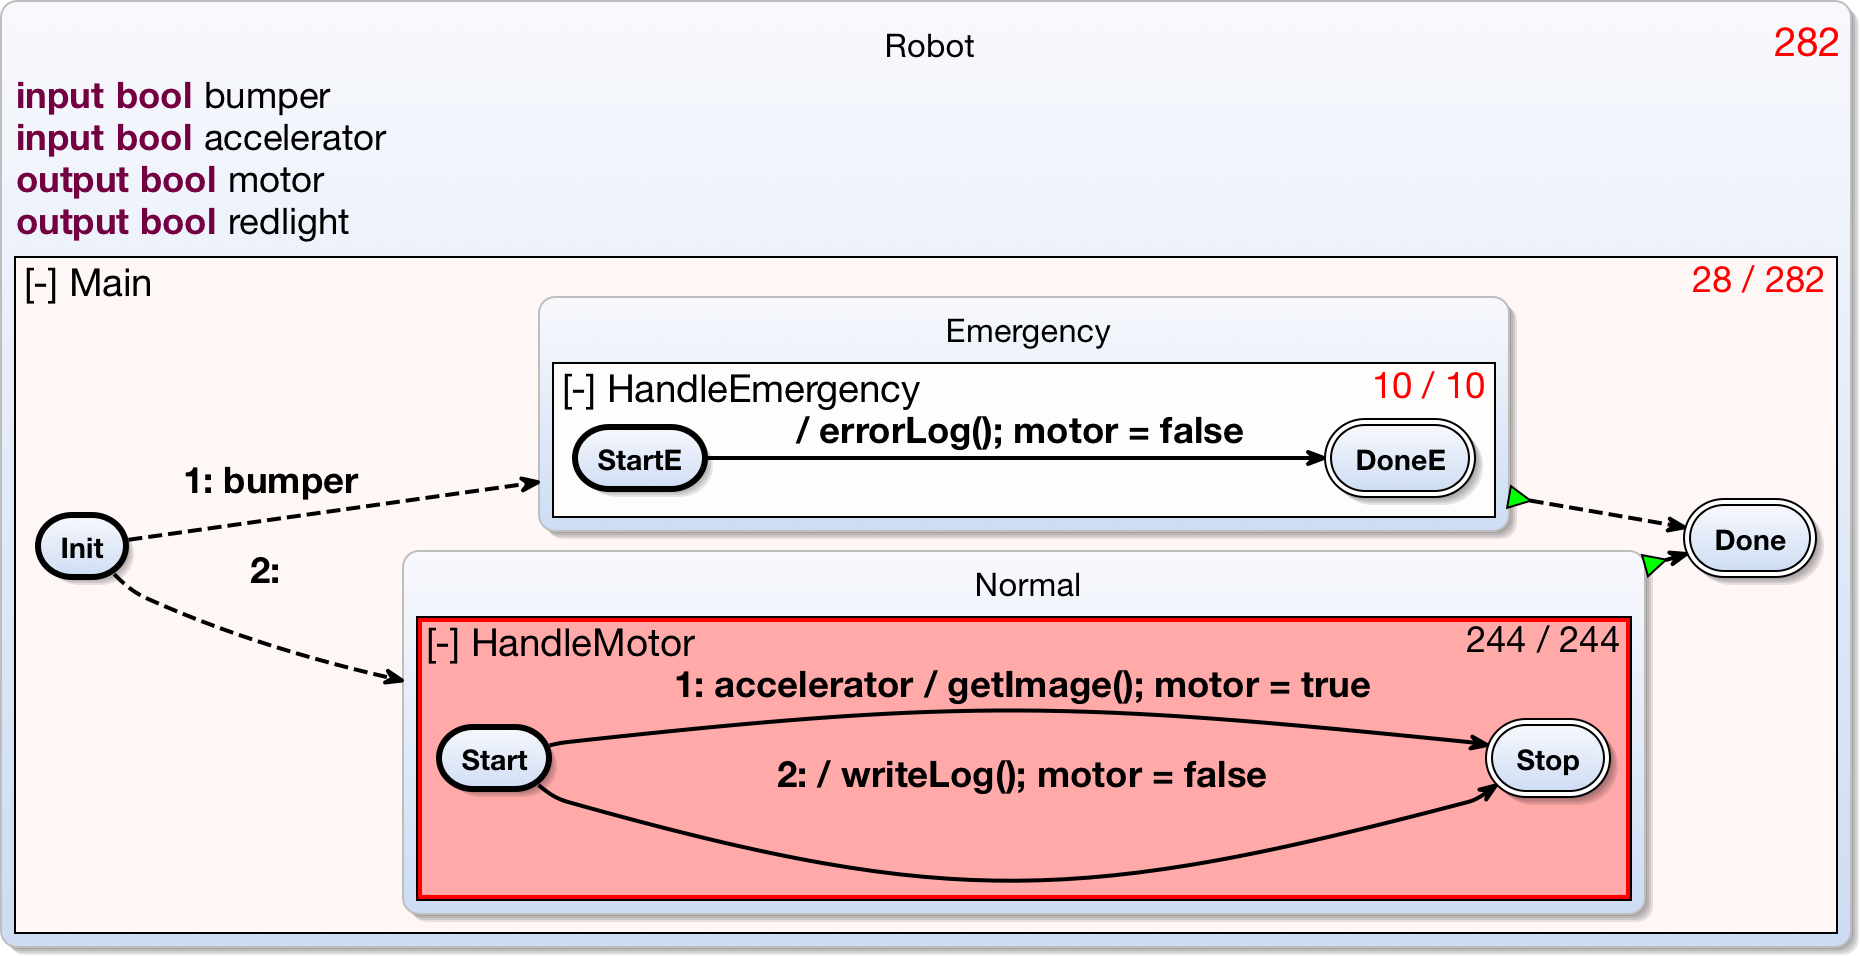
In the new version, getImage() and writeLog() will never be executed in the same tick anymore. The interactively updated time values confirm success: The time value now meets the specification.
If you want to try out our example implementation of Interactive Timing Analysis, here is a quick starting guide.
Overview
Content Tools