The JSON Graph Format
JSON (JavaScript Object Notation) is an open standard format that is widely used and accepted as interchange format on the web. JSON consists of arbitrary key-value pairs. We specify some conventions to represent a graph within this format.
We specify positions of nodes and edges relative to parent nodes, see our KLayoutData Meta Model documentation for further information.
The JSON graph format comprises of four basic elements - Nodes, Ports, Labels, and Edges.
- Each element has an 'id' that identifies it uniquely.
- The first three elements can hold a position and dimension.
- Edges on the contrary can hold bend points specifying where the edge changes direction.
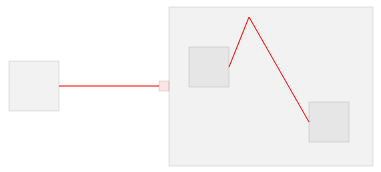
- Nodes can contain child nodes and hold ports that specify attachment points of edges.
- Nodes holding child nodes can specify a padding.
- Multiple edges can be attached to the same port, the port is attached to the node itself.
- All elements can hold labels (despite the label itself).
- All elements can hold properties which represent additional information to the layout algorithm.
Examples
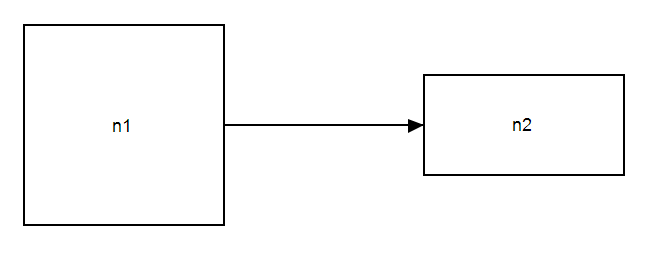
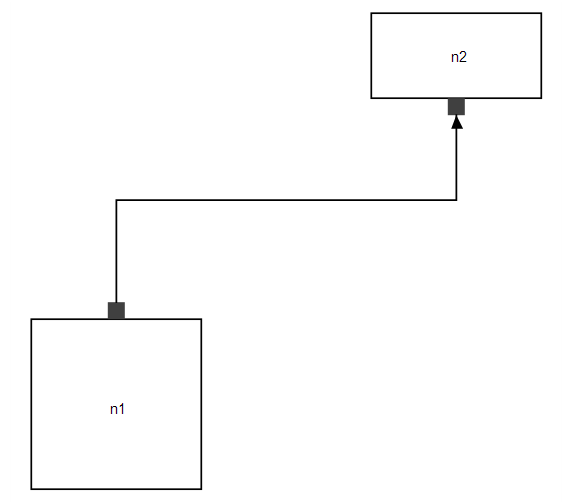
Below are some example graphs in the JSON graph format. You can hop to the Live section of our web service and try them! If you use SVG as output format the graph will be rendered as an SVG image directly within your browser.


