Page History
...
You can specify a list of Jobs. A job is a self-contained unit of work. It specifies the previously mentioned data using the following keywords: resources, layoutoptions, analyses, and output. Layout options are specified by blocks that start with an arbitrary identifier followed by curly brackets. It is possible to specify multiple blocks of layout options. Each block results in a separate layout run allowing, for instance, to first execute a node placement algorithm and then an edge routing algorithm. For convenience it is possible to specify resources and output files globally at the beginning of the file and then use the ref keyword to reference them from a job.
Besides jobs, there is also a RangeJob which are also RangeJobs and CompareJobs. A RangeJob can be used to analyze the effect of a specific layout option onto a specific metric. In the example below, the thoroughness layout option is registered using the rangeoption keyword. An integer range is specified resulting in all values between (inclusive) 1 and 50 being tested. While the analyses specified using the analyses keyword are only measured on the initial graph, the analysis specified using the rangeanalysis keyword will be measured for every tested value of the range layout option. Since analyses can be composed out of multiple components (e.g. the edge crossing analysis states the minimum, maximum, and average number of crossings per edge as well as the sum – four components), the component keyword tells GrAna which component to write to the output file. The CompareJob can apply two different layouts to a graph and compare the results (the graph is copied internally so the layouts do not influence each other). The two layouts are specified via two layout blocks as shown in the avg_distance example below. This kind of job can be used to analyze the effect of a layout on the individual nodes (e.g. the distance nodes are moved).
To execute GrAna based on a .grana file, right click the file and select Execute Analysis Batch ...
| Code Block | ||
|---|---|---|
| ||
globalResources
    random "/Test/random/" filter ".*kgx"
    north_graphs "file://D:/graphs/north" filter ".*graphml"
    secret "/Test/secret/" filter ".*json"

globalOutputs
    original_alg "/Test/results/original.csv"
    awesome_alg "file://workspaces/eclps/Test/results/new.csv"
	thoroughness "/Test/results/thorough.csv"
	compare "/Test/results/compare.csv"

execute all

job original
    layoutBeforeAnalysis
    resources
        ref random
        ref north_graphs
        ref secret
    layoutoptions
        klay {
            de.cau.cs.kieler.algorithm: de.cau.cs.kieler.klay.layered
            de.cau.cs.kieler.klay.layered.crossMin: LAYER_SWEEP
        }
    analyses
        de.cau.cs.kieler.kiml.grana.nodeCount
        de.cau.cs.kieler.kiml.grana.edgeCrossings
    output ref original_alg

job my_awesome
    layoutBeforeAnalysis
    resources
        ref random
        ref north_graphs
        ref secret
    layoutoptions
        klay {
            de.cau.cs.kieler.algorithm: de.cau.cs.kieler.klay.layered
            de.cau.cs.kieler.klay.layered.crossMin: LAYER_SWEEP
            de.cau.cs.kieler.klay.layered.crossMin.awesome: true
        }
    analyses
        de.cau.cs.kieler.kiml.grana.nodeCount
        de.cau.cs.kieler.kiml.grana.edgeCrossings
    output ref awesome_alg

rangejob thoroughness
    resources
        ref random
 layoutoptions
        klay {
            de.cau.cs.kieler.algorithm: de.cau.cs.kieler.klay.layered
            de.cau.cs.kieler.klay.layered.crossMin: LAYER_SWEEP
        }
    analyses
        de.cau.cs.kieler.kiml.grana.nodeCount
    rangeoption
        de.cau.cs.kieler.klay.layered.thoroughness
        intrange 1 to 50
        // floatvalues 0.3, 0.4, 0.5
    rangeanalysis
        de.cau.cs.kieler.kiml.grana.edgeCrossings
        component 3
    output ref thoroughness

comparejob avg_distance
    resources
        ref random
    layoutoptions
        l1 {
            algorithm: fixed
        }
        l2 {
            algorithm: layered
        }
    analyses
        de.cau.cs.kieler.grana.compare.averageDistance
output ref compare |
Eclipse Wizard
Second, you can use an Eclipse Wizard to select one or more sets of graphs, specify and configure a layout algorithm, and select a set of analyses. Results are then written to a .csv file (or more precisely semicolon-separated-file).
The following series of screenshots illustrates the process of using the wizard.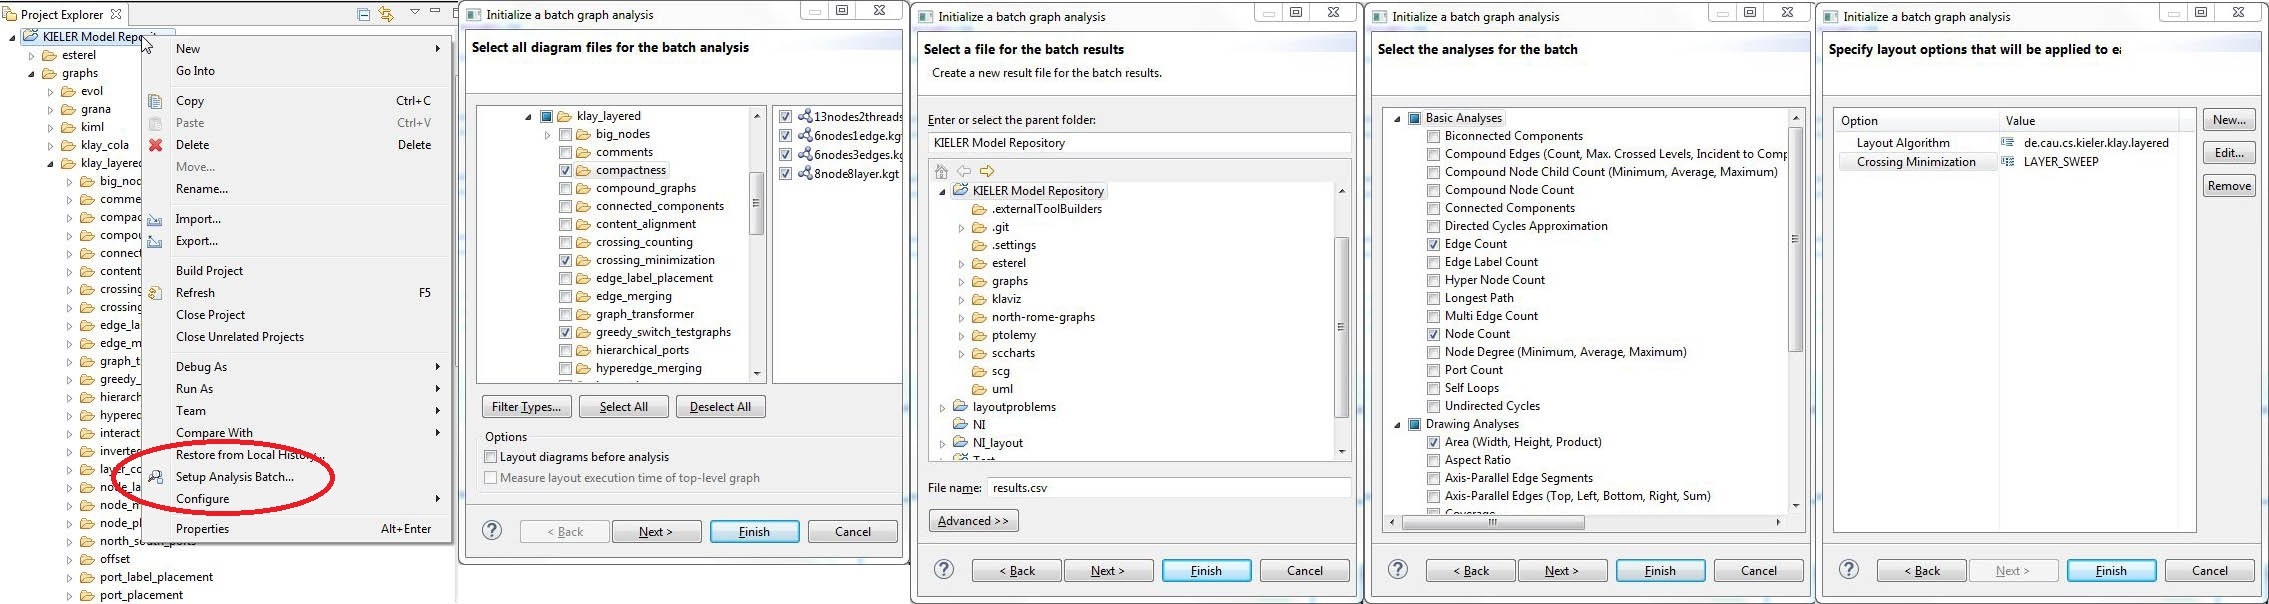
...
Overview
Content Tools