KIELER Lightweight Diagrams (KLighD) allows you to develop visualizations for data structures quite easily. In this tutorial, we will install Eclipse and all the necessary components to develop KLighD visualizations before moving on to actually develop a visualization of a state machine.
TODO: Add a screenshot of what the outcome of this tutorial will be. |
There's a few things to do before we dive into the tutorial itself. For example, to do Eclipse programming, you will have to get your hands on an Eclipse installation first. Read through the following sections to get ready for the tutorial tasks.
Before moving on with this tutorial, it is a good idea to familiarize yourself with the KGraph data structure, which we have a tutorial about (sort of).
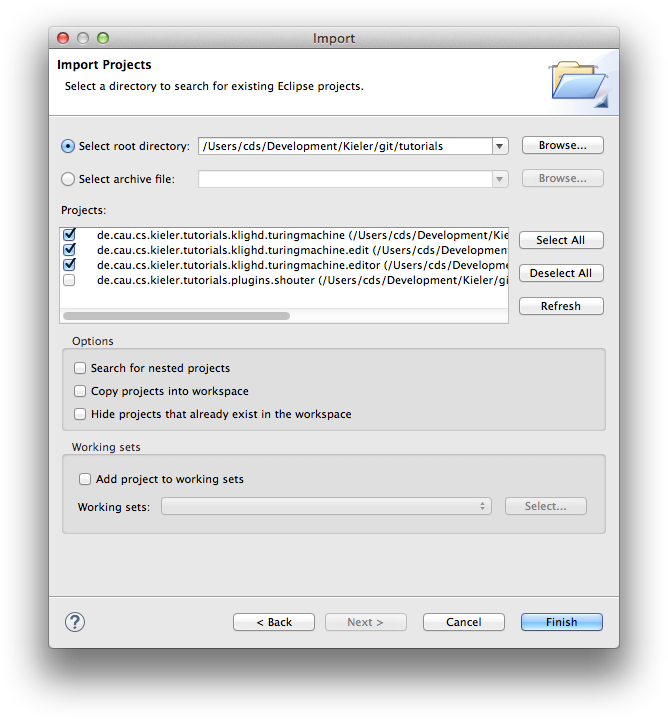
Once you have started your (possibly brand new) Eclipse installation, your workspace is completely empty. For this tutorial, however, we need a bit of sample code to work with:
de.cau.cs.kieler.tutorials.klighd.* projects and press Finish.
The imported projects contain a meta model for Turing machines. (You may notice that this tutorial thus also slips in a perfect opportunity to brush up on your knowledge of Turing machines. Consider it a public service and thank us later.) It does not model the tape or the head, only its states and transitions. It is these Turing machines that we will develop a visualization for over the course of this tutorial.
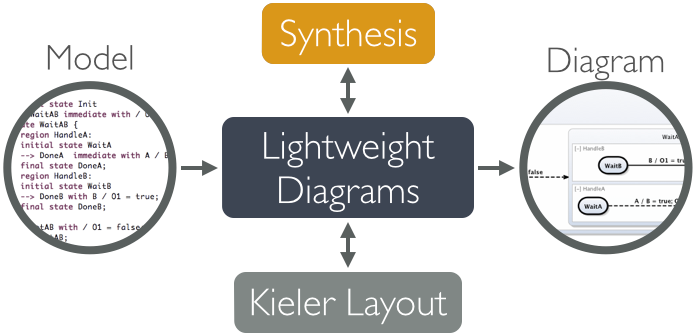
Now that we have the model of what we want to visualize, it's time to program the actual visualization. But first, let's take a minute to think about what we need to do here. Take a look at the following diagram:

In our visualization, what we have is an instance of a Turing machine model, and what we want to end up with is a proper diagram that visualizes it. Of course, Lightweight Diagrams has not the slightest clue about what we want our diagrams to look like. That is where the synthesis, highlightes above, comes into play. The synthesis is what transforms an instance of our source model into a KGraph that Lightweight Diagrams knows how to render. (Along the way, KIELER Layout is invoked by KLighD to compute positions for all diagram elements.)
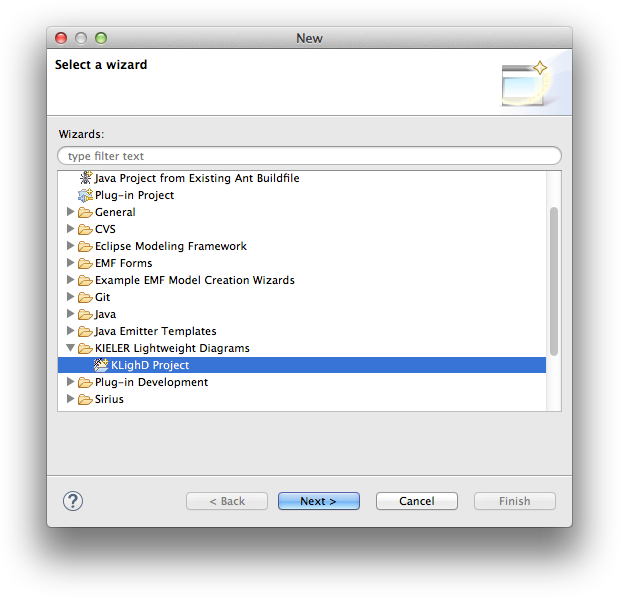
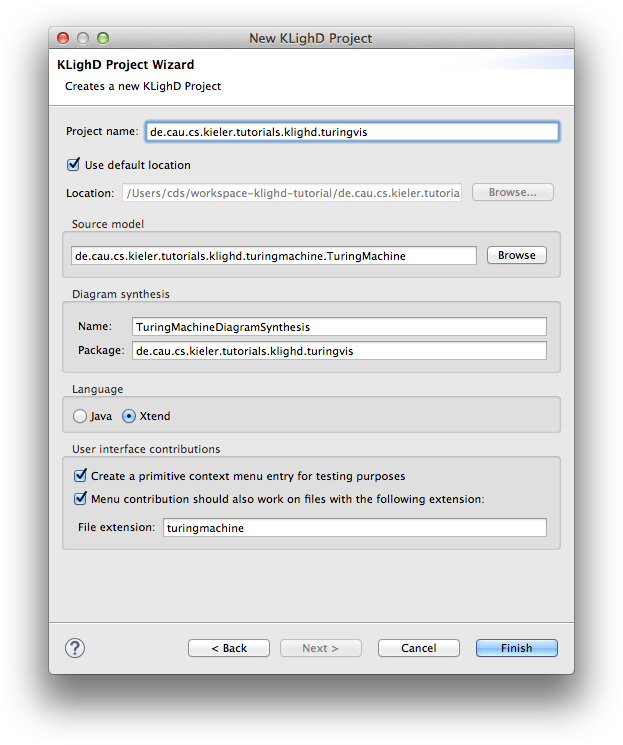
Right, let's dive right in and develop our synthesis.

