Page History
...
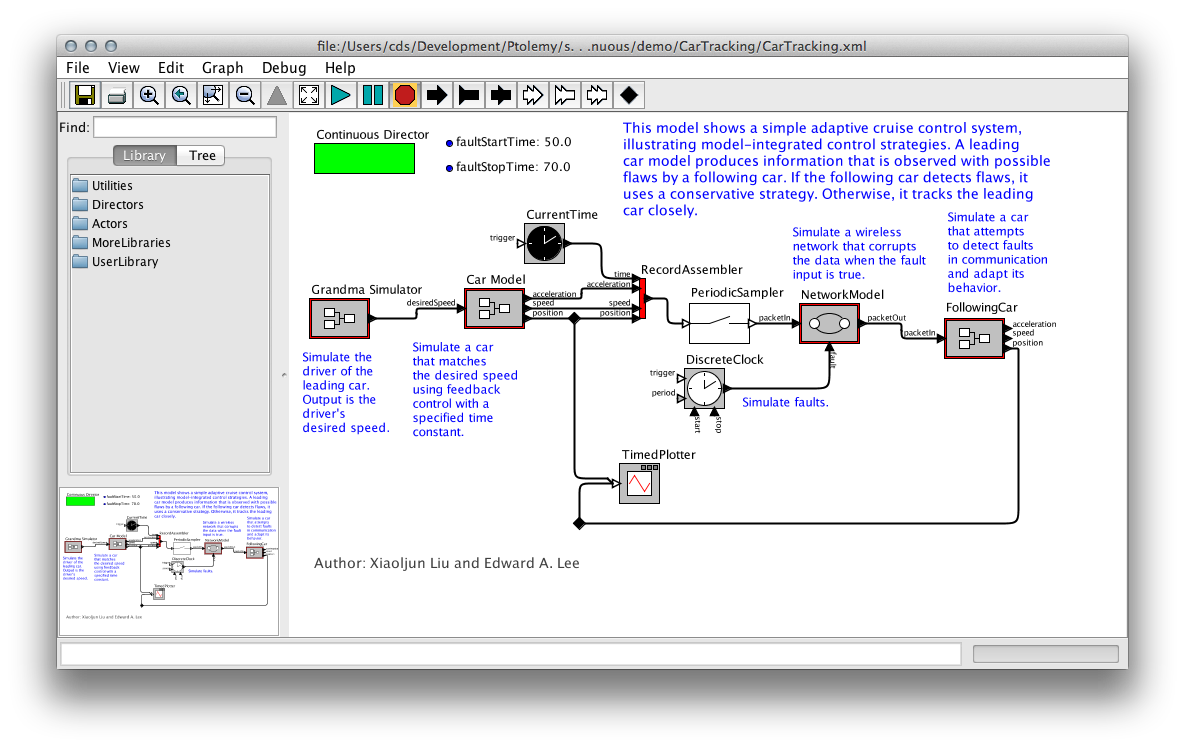
A complex example for using KLighD technology, the Ptolemy Visualization project is about generating transient views of Ptolemy II models that are easy to browse through. Ptolemy II is an open source program developed at UC Berkeley for experimenting with actor-oriented modelling. Actors are graphical representations of components with a certain functionality that generate output as a function of the inputs they receive. To use the output of one actor as the input of another, actors can be connected by links. A typical Ptolemy model might for instance look like this:
| Warning |
|---|
Insert picture of a typical Ptolemy model here. |
In some respect, Ptolemy models are a typical example of graphical modelling languages:
...
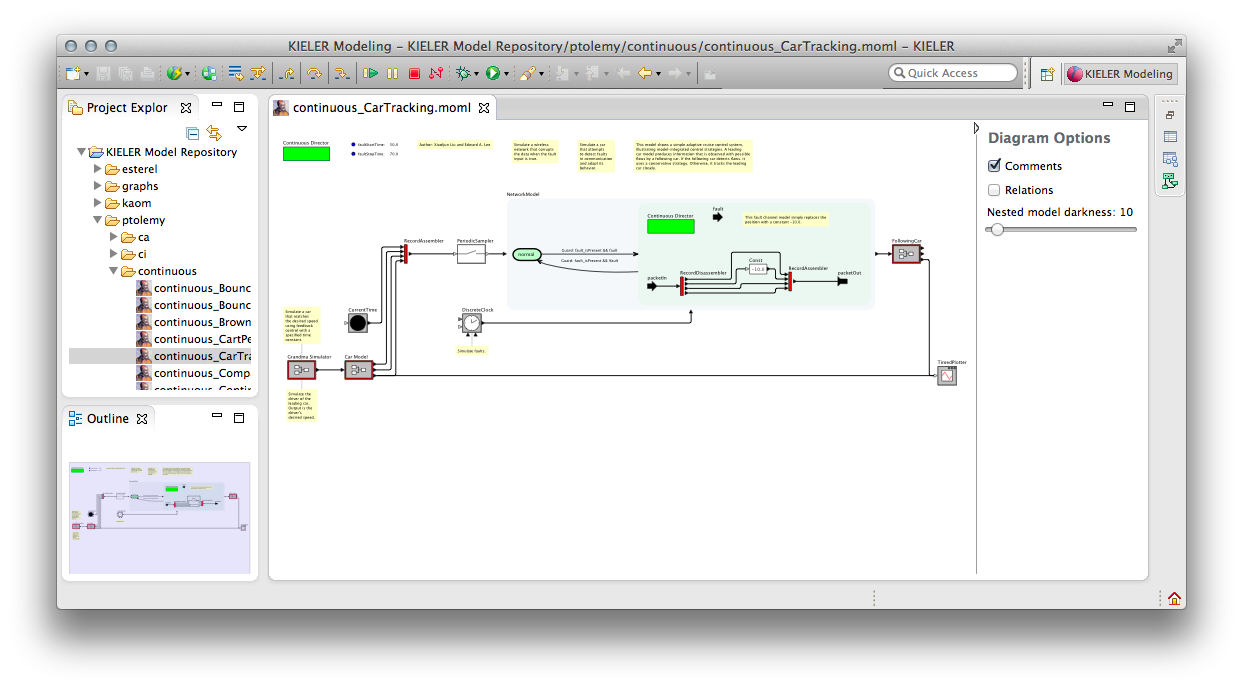
This is a screenshot of the model browser displaying the model that Ptolemy showed before, with some actors expanded:
...
| Tip | ||
|---|---|---|
| ||
Open and browse a Ptolemy model:
|
...
Architecture of the Transformation
...
The transformation is mostly written in Xtend. Its entry point is the PtolemyDiagramSynthesis class, which is registered with KLighD for the visualization of MOML models. It triggers the three different stages of the transformation:
- The basic transformation. This is what turns a given MOML model into a KGraph model.
- An optimization step. A direct transformation of the MOML model doesn't give the best results, which makes this postprocessing step necessary.
- The visualization. This step adds the KRendering information necessary for KLighD to actually display the model.
It would certainly be possible – and perhaps even faster – to combine these stages into one. Doing this, however, would result in code that only John Carmack would understand. And even he would curse reading it.
Generating the Basic KGraph Model
...
Overview
Content Tools