Page History
The KIELER project provides two VS Code extensions klighd-vscode (TODO linkklighd-vscode.vsix) and keith-vscode (TODO link) for keith-vscode.vsix) for a diagram view (D) with several options (E) and a language server with compilation and simulation support.
The language server provided by keith-vscode is consumed by klighd-vscode to also work as a diagram server.
| Table of Contents | ||||||||
|---|---|---|---|---|---|---|---|---|
|
Downloads
VS Code extensions:
TODOFor now, you can find the extensions to manually install into VS Code here or as direct links: klighd-vscode.vsix and keith-vscode.vsix
| Info |
|---|
The Visual Studio Code Marketplace contains a different version of the klighd-vscode extension, please do not use that version for now, as the extensions linked here contain some not-yet-released features and fixes. The files may be updated here in the future to accompany new features/fixes until we release a working version. |
Using the VS Code extensions
Download the two vsix files and install them in your VS Code via Install from VSIX in the view title menu of your Extensions view.
Open a workspace or a folder that contains the files you want to work on.
Open a supported file such as a '.strl', '.lus', 'elkt', 'kgt', or 'sctx' file in your workspace. As a next step should open the diagram view via Open in Diagram the editor context menu (i.e. right click on the editor) or the editor title menu (file with cogs icon F) (big bar on top with two small bars below on the top right of your active editor with a supported file type)
A: Menu bar: Holds the main menu.
B: Left bar: The left bar usally holds the explorer widget and the search widget (only seen as an icon).
C: Left part of Main bar, the editor widget: In the left part of the main bar resides the editor widget. In .
The KIELER view container can be opened by right-clicking the sidebar and selecting KIELER or by View>Open View...>KIELER via the menu.
The current model in the current editor can be compiled by entering Compile current model with... in the command palette (F1 or ctrl+shift + p). Alternatively, this command can be accessed by clicking on the compile icon (E) in the editor title menu (file with cogs on the top right of the editor widget, in the so called tab bar are some editor specific commands accessible. It is possible to compile or simulate the currently opened model via these buttons. These buttons will not directly invoke the compilation but redirect the user to the command palette.D: Right part of main bar, the diagram widget: Shows the current model as diagram. Can also be used to show snapshots of a model to model transformationactive editor).
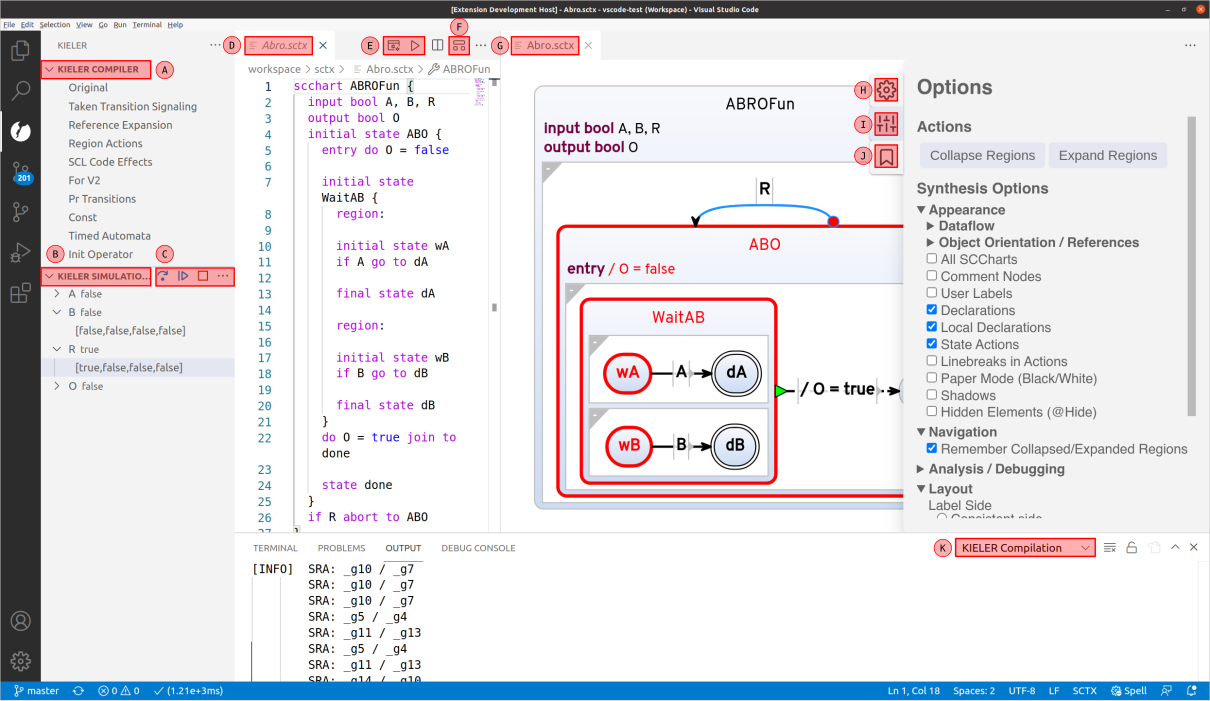
The current model in the current editor can be simulated by entering Simulate current model with... in the command palette (F1). Alternatively, this command can be accessed by clicking on the simulate icon (E) in the editor title menu (play button). During simulation the current state is highlighted marked in red and the last state and taken transition are highlighted in light blue. In the current diagram all "A" states are currently active. In the top right of the diagam widget is the tab bar of this widget. It includes commands to:
- Center the diagram
- Fit the diagram to the widget size
- Compile the shown mode
- Simulate the shown model
E: The right bar: The right bar currently holds the browser preview widget. It can be used to display a visualization of a simulated model. This view can also be opened in another browser tab. The right bar does usually also hold the outline widget, the output widget, and the diagram option widget.
F: The bottom bar: Holds the simulation widget and the compiler widget (in the background). The simulation widget shows the values of a simulated model in form of a table and allows the user to set inputs. Playing, pausing, stepping, and stopping a simulation is supported. On the top right of the simulation widget is the tab bar of this widget. It includes buttons to open the simulation visualization which is currently seen in the right bar.
G: Status bar: Shows the status of tool including:
- errors and warnings in workspace
- Status of compilation and simulation
- Current line number and column
- The end of line sequence (LF)
- Current indentation style (here Tab Size 2)
- Current diagram synthesis (SCChartsSynthesis), which can be changed via clicking it
- The language in the active editor (here SCCharts)
The blue color indicates that the tool has a stable connection to its language server. Yellow indicates a connection loss.
KEITH has some widgets by default, such as the problems-widget, the outline-widget, the output-widget, and the search-widget. All existing widgets are found via the View menu entry or via the command palette.
TODO picture
KIELER compiler widget
The compiler widget shows all snapshots created via the model to model transformations of the currently model. These buttons are clickable and send a request to the LS to draw the clicked snapshot in the diagram view. Snapshots are labeled according to their processor label. Snapshots without labels are models of the previous processor.
This widget is only used for displaying these snapshots. All compilation features can be sued via the tab bar of the editor or diagram widget or via the command palette.
| Info | ||
|---|---|---|
| ||
You can navigate through the snapshots via Alt+G/Alt+J |
Diagram-option widget
The diagram option widget allows to set the diargam options for the currently shown diagram.
On change of the diagram model it updates the options of the diagram via the LSP. The options seen here are SCCharts options.
The command palette
The command palette opens by pressing F1 or opening it via the menu View>Find Command...
On open it first displays the recently used commands and after that all commands in lexicographic order. The command palette can be searched via fuzzy search and supports regular expressions. The displayed commands have of a name (on the left side) and optionally a shortcut to invoke them (on the right side of the command palette). Some commands, such as Auto Save also have an icon associated to them.
Via Ctrl+P the workspace can be searched for files to open. This can also be access via F1 and deleting the > character in the command palette.taken transitions as well as states that were left are marked in blue.
As a result a quickpick menu opens that allows to select the desired compilation chain. The result of the selected compilation is shown the the diagram view (G). All different compilation snapshots can be seen in the KIELER Compiler tree-view (A) in the KIELER view container.
| Info |
|---|
Note that you can compile with a simulation system, e.g. Netlist-based Simulation (C). The result can be simulated by clicking the play button in the diagram view. |
The current model in the current editor can be simulated by entering Simulate current model with... in the command palette (F1). Alternatively, this command can be accessed by clicking on the simulation icon (E) in the editor title menu (play button on the top right of the active editor).
As a result a quickpick menu opens that allows to select the desired simulation chain. After selecting a simulation chain the simulation is executed. All inputs and outputs can be seen in the KIELER simulation tree-view. Next to each variable the current value is displayed (at start the current value is not defined and is, therefore, not visible). By clicking on a variable, the history of their values open. One can change an input value by either clicking on their history or via the context menu (right-click) of the item. This opens a command palette dialog to change to value.
The simulation controls (C) (step, pause, run) are accessible via the view title menu of the KIELER simulation view (B). The three dots in the simulation title menu (C) allow to export or import the trace as well allow to show the simulation visualization (*.kviz) in an external browser.
All infos, warnings, and errors that occur during compilation or simulation are logged to the corresponding KIELER output channels (K).
The diagram settings view (H), the diagram options view (I), which is opened in the screenshot, and the bookmark view (J), which allows to jump to specific viewports in the diagram that were saved earlier, allow to further configure the shown diagram.
Modeling SCCharts
See Quick Start Guide#ModelingSCCharts for details.
Known Problems
Mac
If the app does not start open it via the terminal with
Problem: The exported SVG does have incorrect font sizes.
Solution: Your SVG viewer does not support embedded fonts. Install the fonts Overpass and Overpass-Mono fonts from here. Exporting your SVG via inkscape should not run into this problem.
Problem: The trace file is not saved.
Solution: The extension of the trace file has to be .ktrace otherwise it does not work (might be fixed soon).
An SCChart has to be saved as an .sctx file to be recognized as an SCChart.
Overview
Content Tools