KIELER Lightweight Diagrams (KLighD) allows you to develop visualizations for data structures quite easily. In this tutorial, we will install Eclipse and all the necessary components to develop KLighD visualizations before moving on to actually develop a visualization of a state machine.
| Warning |
|---|
TODO: Add a screenshot screen shot of what the outcome of this tutorial will be. |
...
- Download the zip file with all our prepared tutorial plugins from our Stash. Unzip the file.
- Open the context menu within the Package-Explorer (on the very left, right-click the empty space).
- Select Import. Then chose General > Existing Projects into Workspace.
- Browse to the location where you unzipped the downloaded plug-ins. Check the checkbox check box in front of all the
de.cau.cs.kieler.tutorials.klighd.*projects and press Finish.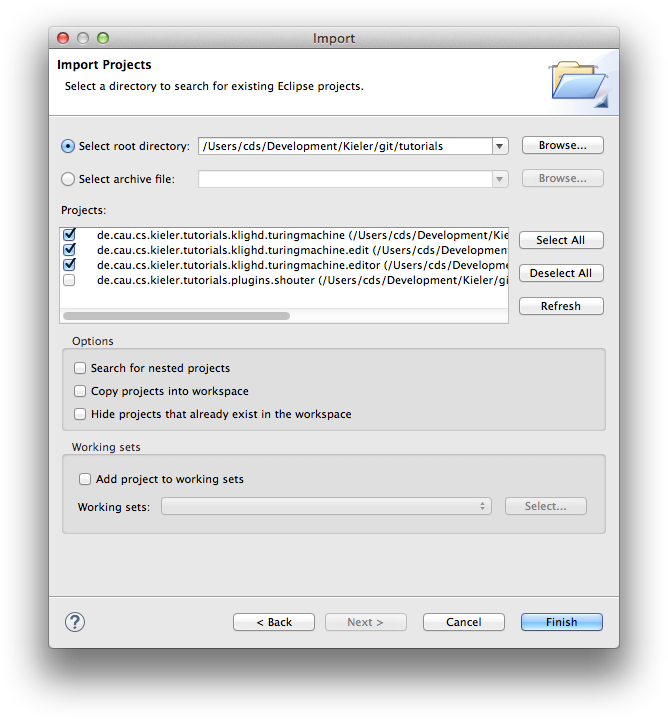
...
In our visualization, what we have is an instance of a Turing machine model, and what we want to end up with is a proper diagram that visualizes it. Of course, Lightweight Diagrams has not the slightest clue about what we want our diagrams to look like. That is where the synthesis, highlightes highlighted above, comes into play. The synthesis is what transforms an instance of our source model into a KGraph that Lightweight Diagrams knows how to render. (Along the way, KIELER Layout is invoked by KLighD to compute positions for all diagram elements.) However, the KGraph itself does not suffice to render the diagram: it only specifies its structure, but not its appearance. To specify the latter, we also need to augment our KGraph by KRendering information. See its documentation to learn more about what it can do.
...
- Right-click the Package Explorer and select New -> Project.
- In the dialogdialogue, select General -> Project and click Next.
- Give the project a meaningful name (Foo is a classic) and click Finish.
- Right-click your new project in the Package Explorer and select New -> Other.
- In the dialogdialogue, select Example EMF Model Creation Wizards -> Turingmachine Model and click Next.
- Give your Turing machine file a meaninga meaningful name (Bar.turingmachine is a classic) and click next.
- As the Model Object, select Turing Machine, which is the root element of our model. Click Finish.
- In the editor that opens, expand the first row. Make sure the Properties view is open by right-clicking in the editor and selecting Show Properties View.
- Right-click Turing Machine and select New Child -> State. Give the state a name through the properties view, such as Wilhelm Tell. Also mark it as the initial state of the Turing machine.
- Add another, non-initial state named Apple.
- Save the file.
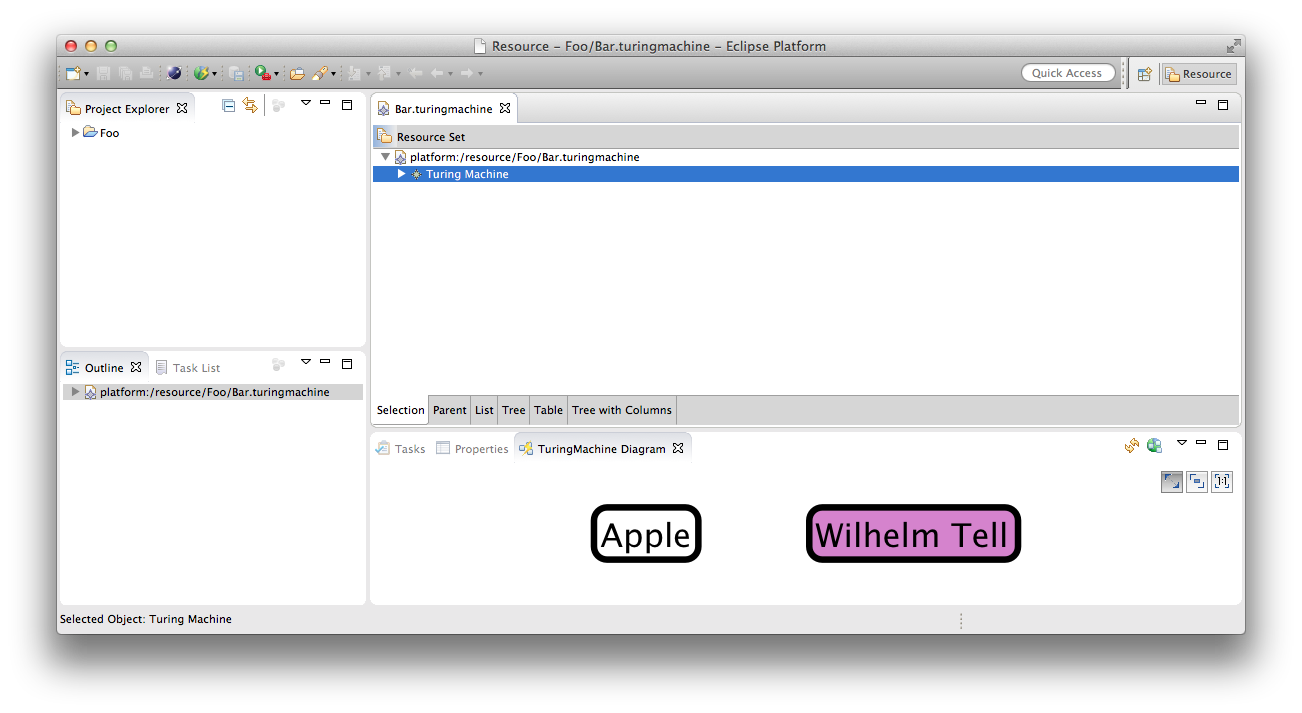
To test your visualization, you can right-click either the file in the Package Explorer or the Turing Machine row in the editor and select Open TuringMachine diagram. A KLighD view should open and display something like this:
That's quite nice already, but we have no way to determine which of these states is the default. Let's add a hideously ugly background colour to initial states by changing the line that adds a rounded rectangle:
| Code Block |
|---|
stateNode.addRoundedRectangle(4, 4, 2) => [ rect |
    if (state.initial) {
        rect.setBackgroundColor(210, 130, 210);
    }
]; |
The result should look something like this (I told you it was going to be hideous):