To demonstrate the possibilities of this framework, we represent the results of specialized transformations for three graph structures.
General structure
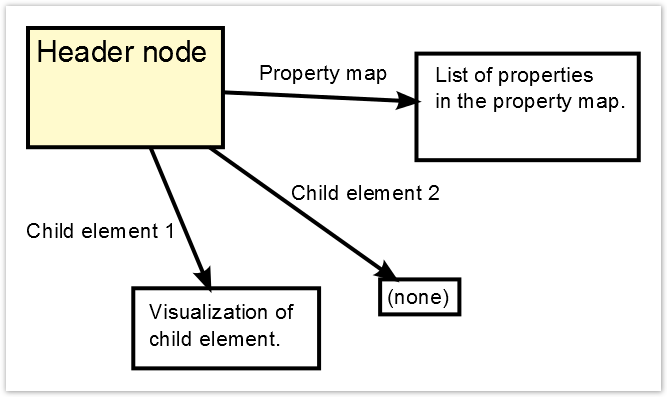
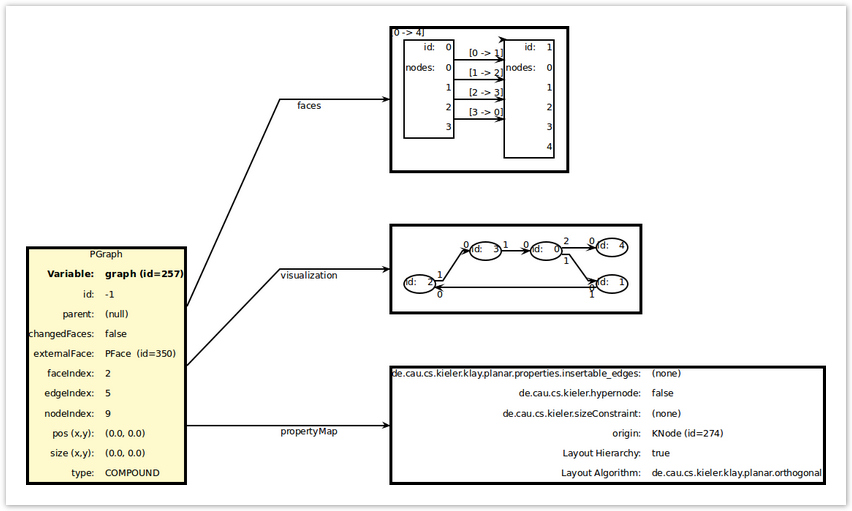
All visualizations follow the same general structure:
- A header node (colored in lemon) representing the currently selected element.
- A visualiation of the properMap in tabular form.
- A node for each child element. (e.g. visualisation of a graph, the bendPoints of a edge...)
These main nodes all have a linewidth of 4 and are connected from the node by a directed and labeled edge. If one of the nodes is empty (e.g. there are no bendPoints on the selected edge), the node is still rendered and filled with the text "(empty)". Elements in these main nodes normally have a linewidth of 2.
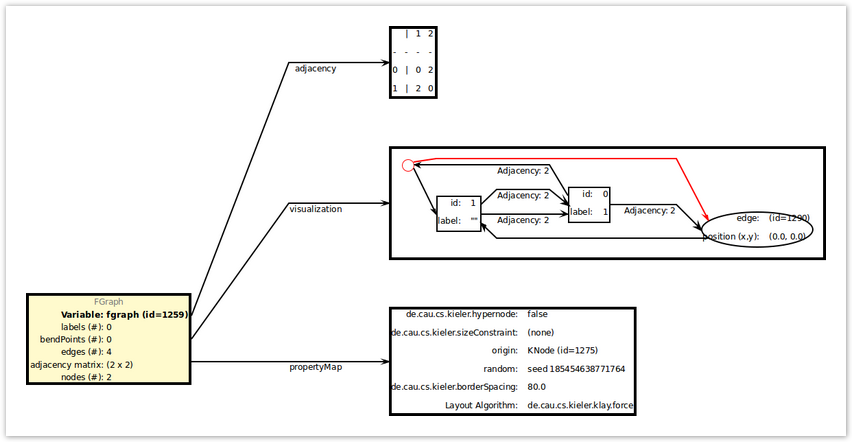
Visualization of FGraph
There are visualizations for
- FGraph
- FNode
- FEdge
- FBendpoints
- FLabel
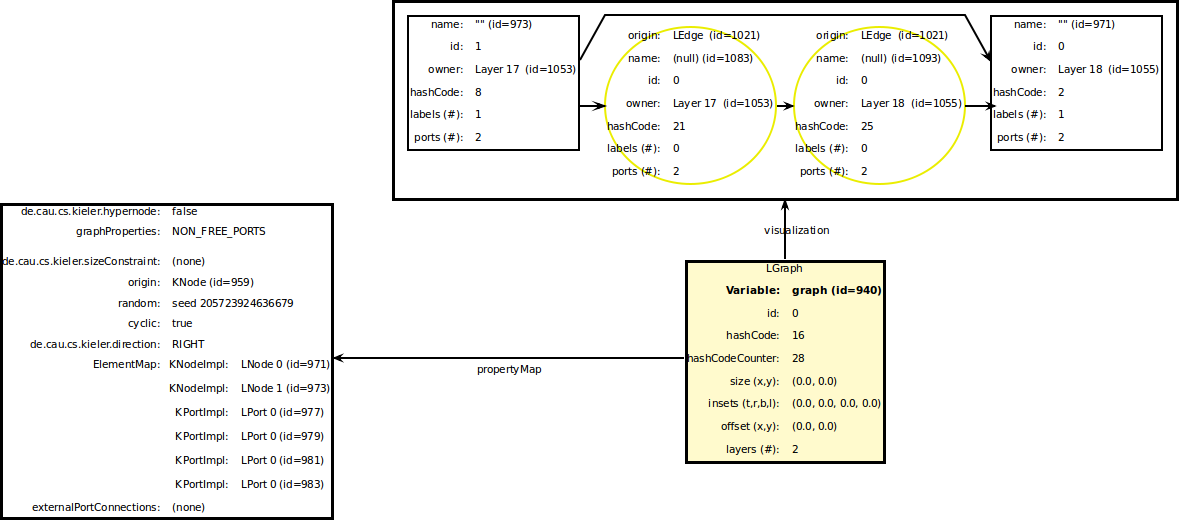
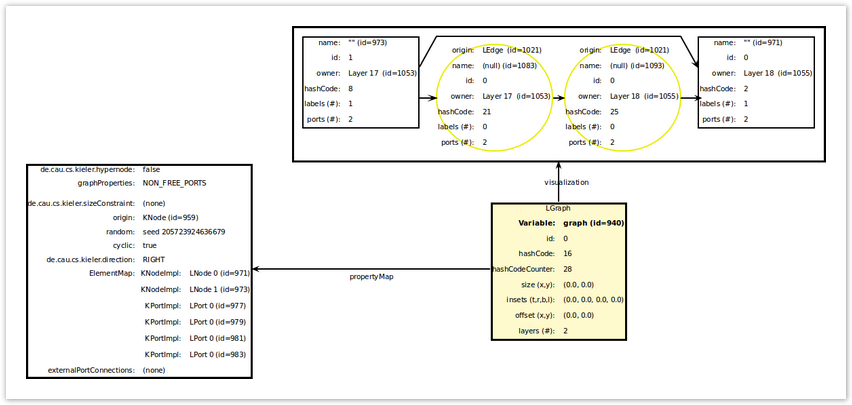
Visualization of LGraph
- LGraph
- LLayer
- LNode
- LEdge
- LPorts
- LLabel
Visualization of PGraph
- PGraph
- PNode
- PEdge
- PFace
- PLabel
Class KTextIterableField.java
In the process of development a class for the creation of table layouts was generated. It provides the user with a very easy way to create table layouts. It is not necessary to specify the size of the table. The user simply adds elements to a arbitrary positions of the table. Also a table head can be added. This element will be centered above all other table elements. After fully filling the table, the table elements are added by iterating over the structure. Each element is returned as a KText.
Later we dropped the use of this class, as the usage of the GridLayout is recommended. As an example, the class is still used in following transformations:
- FEdgeTransformation
- FGraphTransformation
- FLabelTransformation