Page History
...
Now start modeling an SCChart. For example copy & paste the following sct code of abo, the hello world of SCCharts:
| Code Block | ||
|---|---|---|
| ||
@VHLayout
scchart ABO {
  input output bool A;
  input output bool B;
  output bool O1;
  output bool O2;
  region:

  initial state Init
  --> WaitAB immediate with / O1 = false; O2 = false;
  state WaitAB {
    region HandleA:
    initial state WaitA
    --> DoneA  immediate with A / B = true; O1 = true;
    final state DoneA;
    region HandleB:
    initial state WaitB
    --> DoneB with B / O1 = true;
    final state DoneB;
  }
  >-> GotAB with / O1 = false; O2 = true;
  state GotAB;
} |
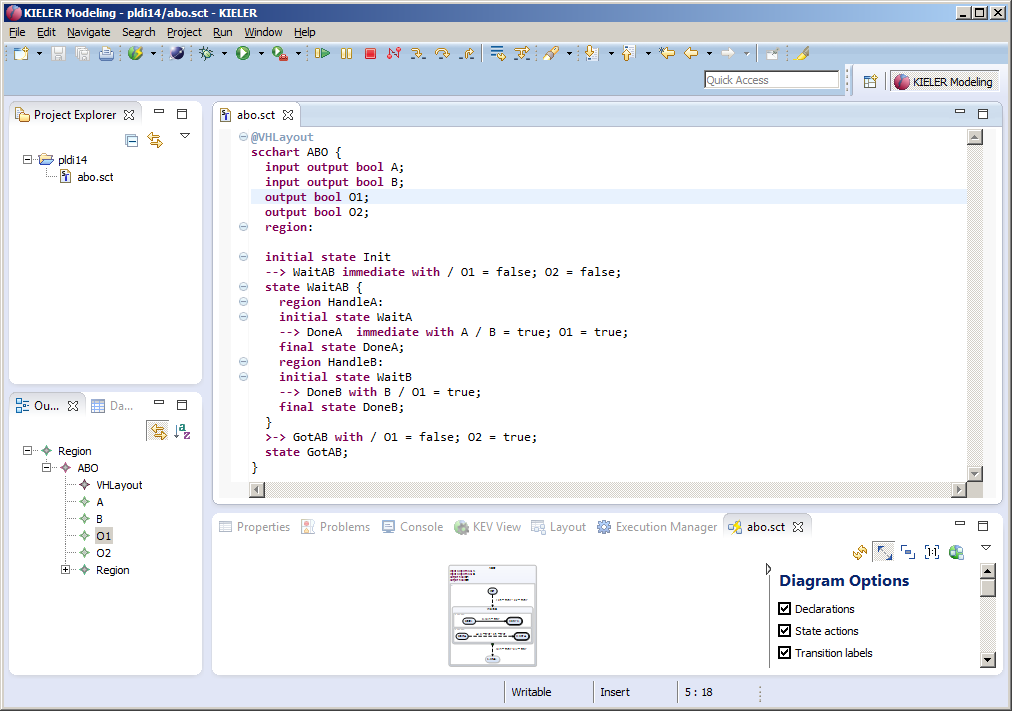
As you save (Ctrl+S), KIELER will automatically draw the graphical SCChart diagram in a new KLigD view:
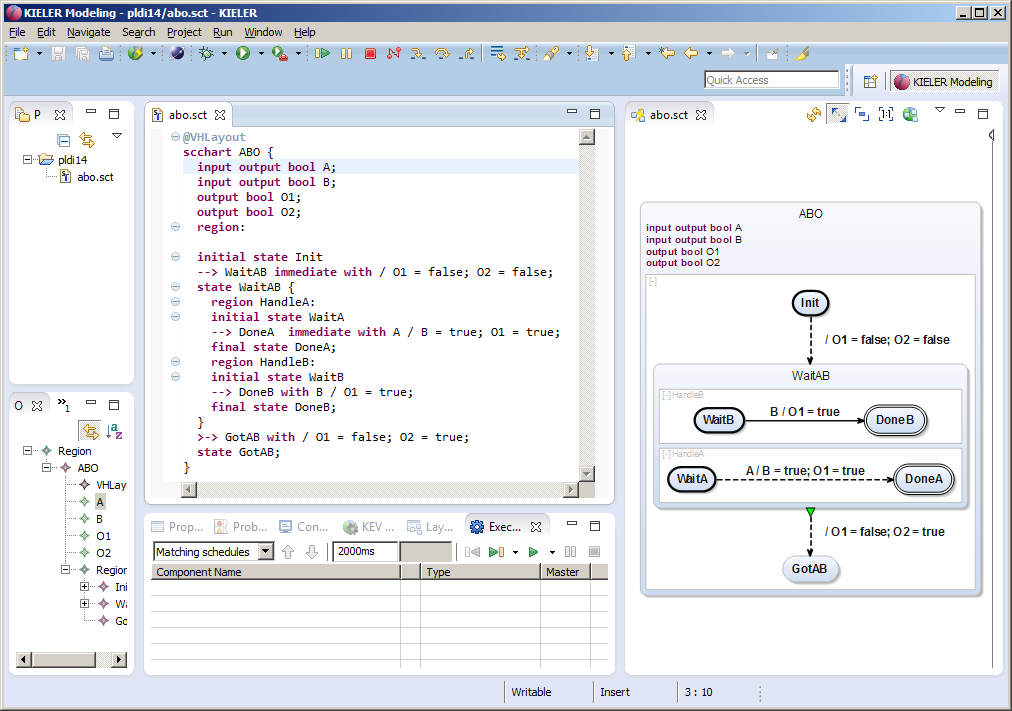
You may want to re-arrange views. Just drag the KLighD view to the right side:
Generate C Code
xxx
Overview
Content Tools