Page History
| Info |
|---|
We have moved the guide that shows how to model and compile an SCChart within KIELER to a new Quick Start Guide (pre 0.13). Be advised that in order to follow all explanations there may require the latest version of KIELER not the (possibly outdated) PLDI-Artifact. |
Modeling SCCharts with KIELER – PLDI'14 Artifact
This tutorial should guide you if you like to model SCCharts with KIELER and use the circuit based software synthesis path as explained in our [1] PLDI'14 submission. We will show you how to
...
We will use a simple example here in order to illustrate the process. It should be straightforward to use these instructions in order to compile a more advanced SCChart. Note that there are known minor bugs in the current nightly build that will be fixed in the next release of KIELER 0.10.0. These bugs might in some cases prevent you from compiling more elaborate examplesPlease refer to the SCCharts superpage for the project status and known limitations. If you are interested in the source code you can find instruction how to download and compile it here: Getting Started.
See a list of the evaluated examples at the end.
[1] PLDI submission: http://rtsys.informatik.uni-kiel.de/~biblio/downloads/papers/pldi14-submitted.pdf
In addition to the step-by-step tutorial below we also captured a video that shows each of the explained steps:

Download location: http://rtsys.informatik.uni-kiel.de/~kieler/files/pldi14/sccharts.swf
1. Download & Start KIELER
Download a suitable KIELER version for your operation system. The zip bundles are fully compiled and ready-to-run, they do not need any further installation process. Just save and extract them to/at the location of your choice and start the KIELER executable.

Download Locationlocation: http://rtsys.informatik.uni-kiel.de/~kieler/files/pldi14/
...
Now you can proceed in modeling an SCChart as explained below.
2. + 3. Model and Compile an SCChart
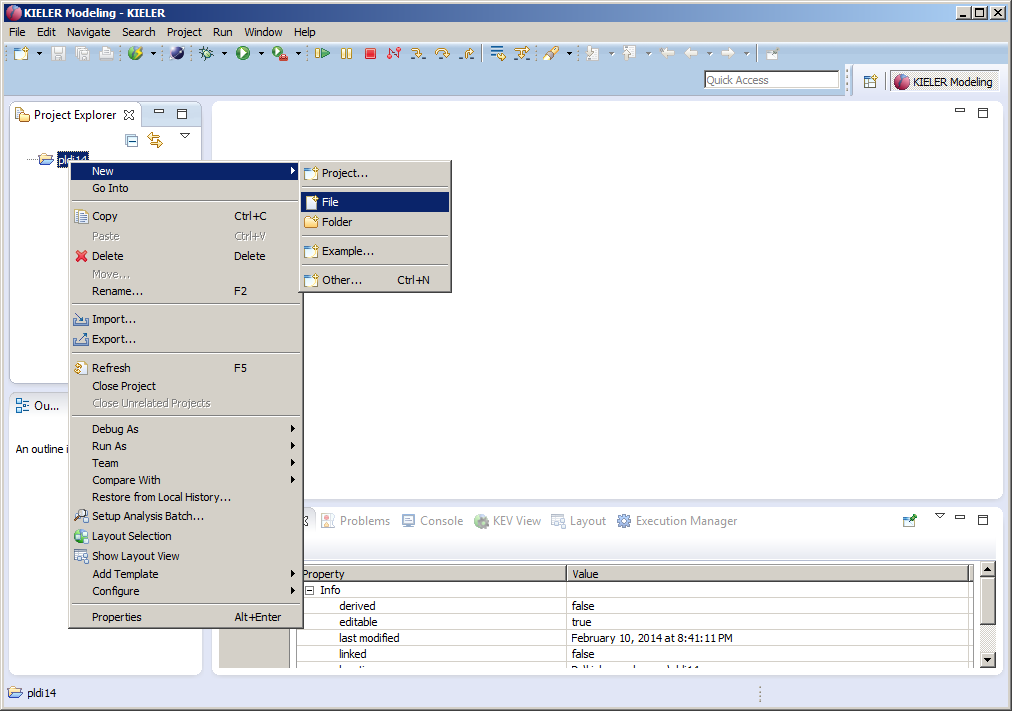
Right-click on a project and create a (text) File:
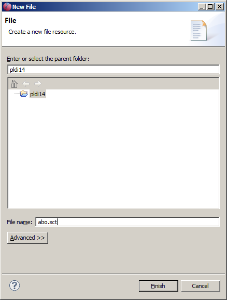
Name it abo.sct:
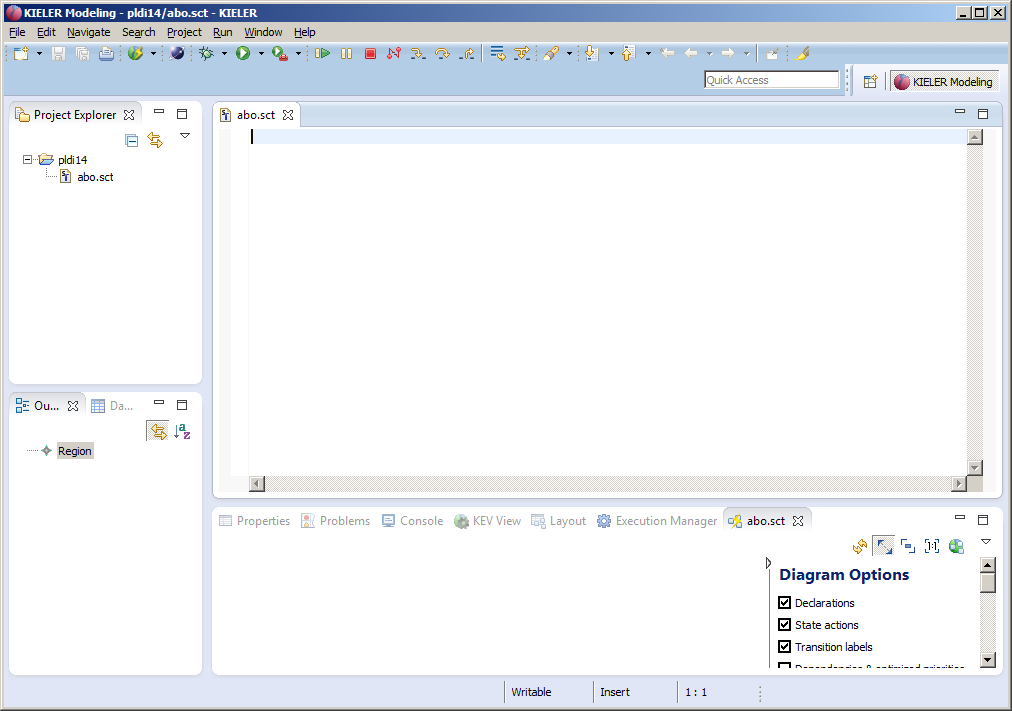
The textual SCCharts Xtext based editor (for *.sct files) will automatically be opened:
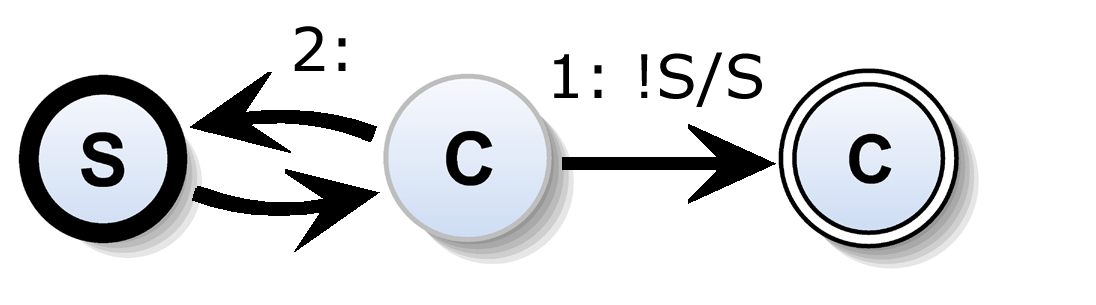
Now start modeling an SCChart. For example copy & paste the following sct code of abo, the hello world of SCCharts:
| Code Block | ||
|---|---|---|
| ||
scchart ABO {
  input output bool A;
  input output bool B;
  output bool O1;
  output bool O2;
  region:

  initial state Init
  --> WaitAB immediate with / O1 = false; O2 = false;
  state WaitAB {
    region HandleA:
    initial state WaitA
    --> DoneA  immediate with A / B = true; O1 = true;
    final state DoneA;
    region HandleB:
    initial state WaitB
    --> DoneB with B / O1 = true;
    final state DoneB;
  }
  >-> GotAB with / O1 = false; O2 = true;
  state GotAB;
} |
Generate C Code
xxxWe have moved the guide that shows how to model and compile an SCChart within KIELER to a new Quick Start Guide (pre 0.13). Be advised that in order to follow all explanations there may require the latest version of KIELER not the (possibly outdated) PLDI-Artifact.
4. Evaluated Examples
In the following, you find the examples used for evaluation. Be advised that there currently is no tool integrated evaluation possible. Please refer to the SCCharts superpage for the project status and known limitations.
Find the list of Examples used for evaluation here.
Overview
Content Tools