Page History
ThinKCharts User Guide
Thin Kieler
...
SyncCharts Editor
Authors:
- Matthias Schmeling <schm at informatik.uni-kiel.de>
- Hauke Fuhrmann <haf at informatik.uni-kiel.de>
Topics
...

Create a new Diagram

- To create a new SyncCharts diagram first create a new project. (New->General->Project)
- Then create a new syncChart. (New->SyncChart Diagram)
- The wizard asks you for the name of the diagram file and its corresponding model file. These should be the same for both files.

- Use the KIELER main menu to add some default initial syncChart to your canvas to start from. Now you have a new syncChart with a top level state that contains a region. Note that there should only be one top level state in a syncChart.

Editing the diagram
Context Menu
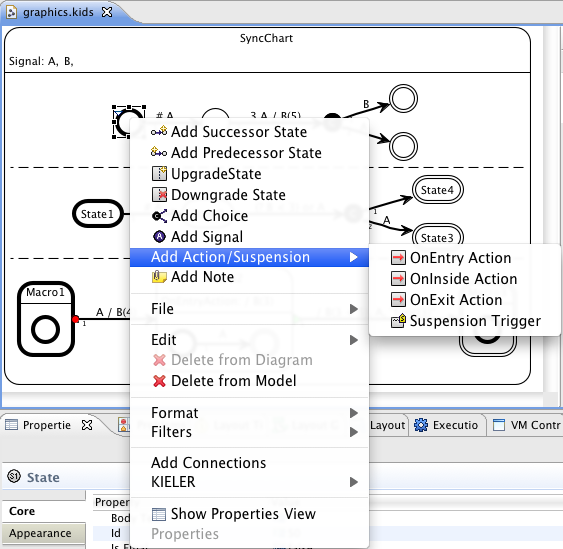

- Use the context menu(right-click) to add most of the items
- Add Successor State: Add a state with a transition following the currently selected state.
- Add Predecessor State: Add a state with a transition with a transition to the currently selected state.
- Upgrade State: Add a Region into a State and an initial State into that Region. Can be called either on Simple States or on Macro States.
- Downgrade State: Remove a Region from a State.
- Add Choice: Add a Conditional Pseudo States with two target States.
- Add Signal: Add a Signal declaration to a State.
- Add Action/Suspension? : Add a State Action (OnEntry, OnInside (will be executed every tick), OnExit) or a Suspension Trigger. The first three may also contain a Trigger (hence a pure effect needs to start with a slash "/"), the latter is only a Trigger and may not contain an effect.
- Connect States: Add a Transition between the two selected States.
- Flip Transition: Change source and target of selected Transition.
- Set Transition Target/Set ? Transition Source: Change either the target or the source of the currently selected transition to the currently selected State. Requires tp select exactly one Transition and one State.
Palette
The Palette is only there for old-style drag-and-drop editing. It is discouraged to use the palette to insert states and transitions. Better use the context menu as described above to edit the diagram with Structure-Based Editing operations. It will also automatically use auto-layout to get a nice graphical layout of the diagram.
Properties
- Use the properties view to change internal attributes of graphical objects
- Open by
- Window->Show view->Properties or
- Right-click in the graphical editor -> Show Properties View
- Example attributes to change
- Labels and IDs of States
- Types and flags of States (Conditional, normal, reference, initial, final...)
- Types and flags of Transitions (weak or strong abortion, normal termination, immediate, delay, history...)
...
Graphical Elements in a ThinKCharts SyncChart
...

Interface Declaration Parser
- Signals and Variables can be declared in a textual representation for a specific state and this state's subregions.
- If you are familiar with Xtext grammars or ENBF see following links for the complete syntax
- Xtext: InterfaceDecl.xtext in de.cau.cs.kieler.synccharts.interfacedeclparser
- ENBF: InterfaceDecl.html in de.cau.cs.kieler.synccharts.interfacedeclparser
- Xtext: InterfaceDecl.xtext in de.cau.cs.kieler.synccharts.interfacedeclparser
Short Sample
- signals can be added using the signalkeyword finished by a semicolon.
- there can be an arbitrary number of comma separated signals
- inputs are declared by using the keyword input (same for output and input output)
- variables are added in a similar way like signals by using the varkeyword finished by a semicolon.
- there can be an arbitrary number of comma separated variables just like for the signals
- an initial value is defined by :=following directly after the signal's name (care: use quotation marks for the value, as the underlying type is EString)
- the value type can be declared directly afterwards with a preceding colon
- the combine operator and value type are declared by the keywords combine ... with
- possible combine operators : NONE, +, *, max, min, or, and, host
- possible value types : PURE, BOOL, UNSIGNED, INT, FLOAT,HOST
- signals and variables for a state's subregions are declared starting with region's identifier followed by a colon (R0: signal... for region R0)
- you can use single line comments and multi line comments /* */ as you like
...
- Action and Transition labels get automatically parsed and checked for correctness by a complex parser.
- The label language mainly follows Esterel and E-Studio label Syntax.
- For details, see
- full label syntax grammar in Xtext notation: de.cau.cs.kieler.synccharts.labelparser/src/de/cau/cs/kieler/synccharts/labelparser/ActionLabel.xtext
- full label syntax grammar in EBNF notation: de.cau.cs.kieler.xtext.docgenerator/src-gen/de.cau.cs.kieler.synccharts.labelparser.ActionLabel.html
General Form
Action:
	(isImmediate?='#')? (delay=INT)? (trigger=BooleanExpression)? ("/" (effects+=Effect (',')? )*)?;
...
- Finally, you should regularly test if your syncChart is correct. To do this, click on Diagram->Validate. Inconsistencies in your diagram are indicated by little red icons and also an entry in the problems view. Note that the validation may still be incomplete and not be able to point out all errors.
- Your diagram gets validated automatically whenever it is saved.
- For details on the checks performed see the Checkfile in Xtend Check language syntax: de.cau.cs.kieler.synccharts/model/SyncchartsChecks.chk
Differences to the original SyncCharts
...
| Source/Target? | States | Regions | Transitions |
| State | replace each | insert into each | insert into each |
| Region | insert into each | replace each, if root: do nothing | insert into each |
| Transition | Connect 2 states | add two dummy states with transition in each | replace each |
| States | replace each with all | insert all into each | insert into each |
| Regions | insert all into each | replace each with all | insert into each |
| Transitions | Connect 2 states with all | add two dummy states with all transition in each | replace each with all |
Overview
Content Tools