This tutorial uses the KIELER Environment Visualization (KEV) to display the state of a very simple street light controller. This process is split into the following steps:
- create an SVG image
- create a mapping file for this SVG
- open the mapping file in KEV
- create a street light controller in SCCharts
- simulation the controller, including visualization
1. Creating an SVG Image
In this tutorial the open-source vector graphics program Inkscape is used to create an SVG image. It is advisable to first set the document size. In Inkscape this is done under File > Document Settings. In the image below the size is set to 512x512 px. This setting defines the coordinate system of the file, which is useful when animating e.g. movement later in KEV. However, SVG images can be scaled to any size.

Afterwards three circles and a rectangle are created. The circles will simulate the red, green and yellow light of a traffic light, and thus are colored accordingly. The rectangle will show the same information, but using different animations.

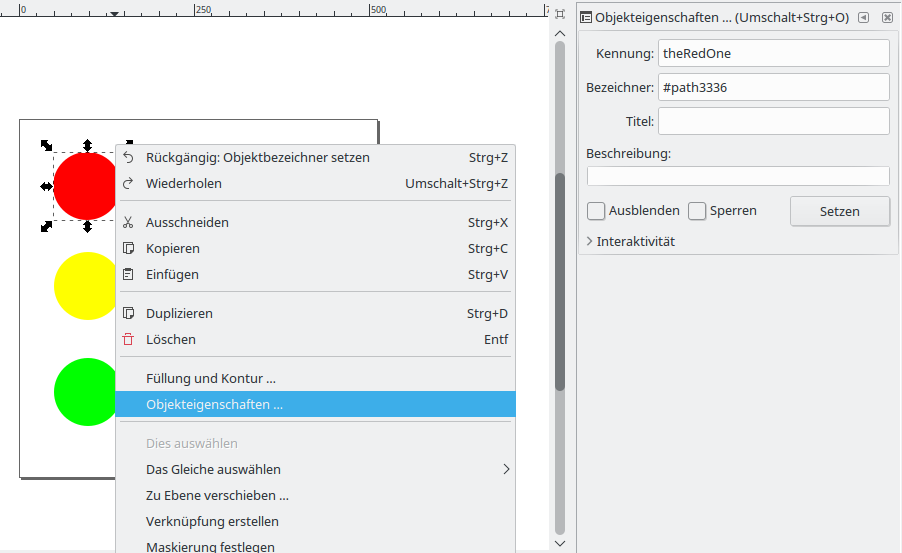
After the elements of the image have been created, it is necessary to give each element a unique name if it should be animated. This can be done in Inkscape by selecting the object and using Right click > Object properties. In the window that opens, an id can be set in the first field (default value without leading hash, labelled "Kennung" in german). Name the circles according to their color, theRedOne, theYellowOne and theGreenOne. The rectangle gets the id theRect.
Note that a new id has to be applied using the button in the object properties window!
Finally, save the result as Inkscape-SVG or Normal-SVG and name it Lights.svg.
2 Mapping animations to SVG elements
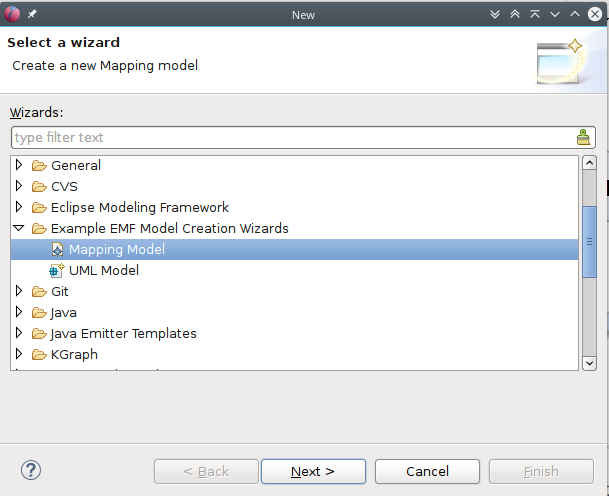
In the following a mapping of animations, domains and variables to elements in the SVG is created. Therefore one has to create a new mapping file in KIELER using File > New > Other > Mapping Model. Name the file Lights.mapping and select SVG File as Model Object.
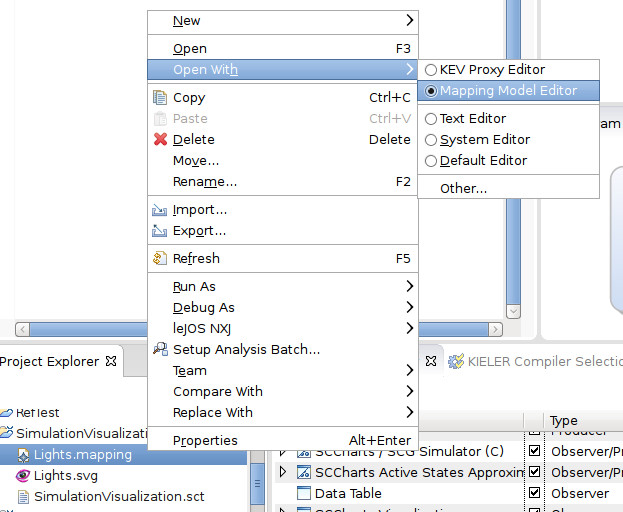
After hitting Finish, the file has to be opened using Open With > Mapping Model Editor.
In the editor that opens, select the SVG File element. If there is no Properties view open , select
Overview
Content Tools