Starting to model SCCharts with the KIELER tool usually includes the following steps:
Installing KIELER
Download a suitable KIELER version for your operation system.
The zip bundles are fully compiled and ready-to-run, they do not need any further installation process. Just save and extract them to/at the location of your choice and start the KIELER executable.
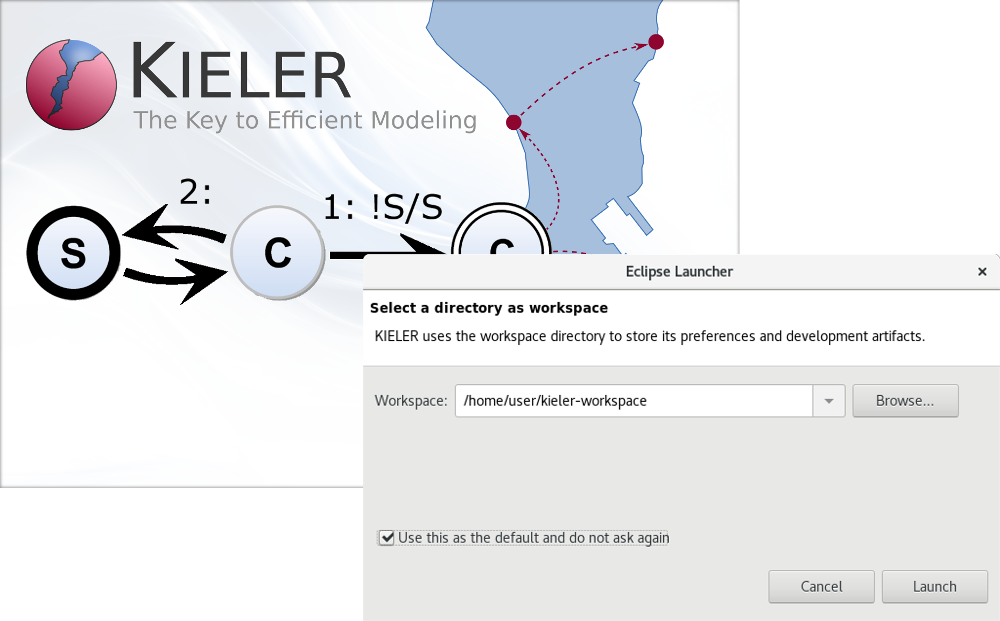
When you start the KIELER executable, you probably need to set a (new) workspace location of your choice.
If you selected a new workspace location, you will see a welcome screen like this:
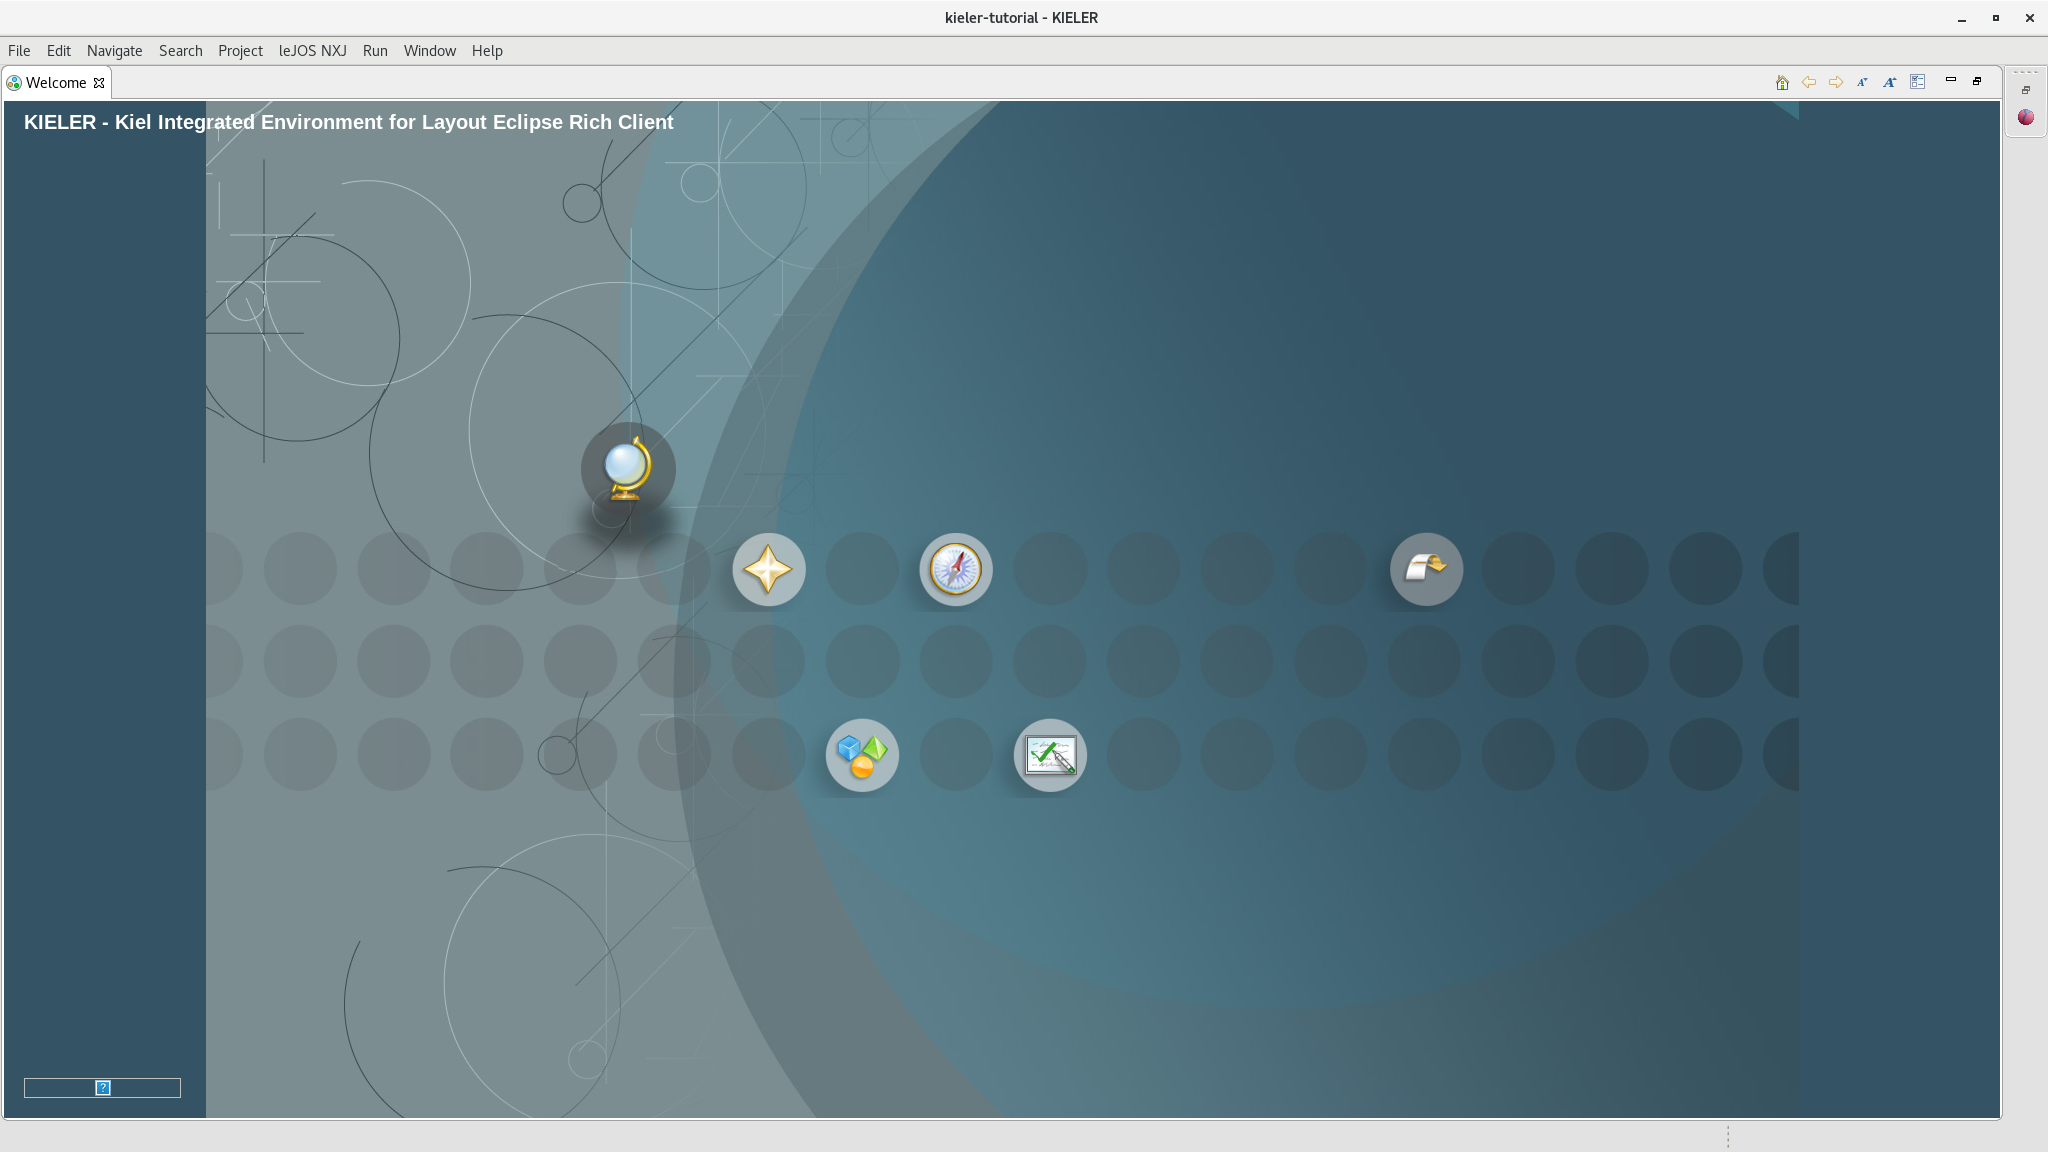
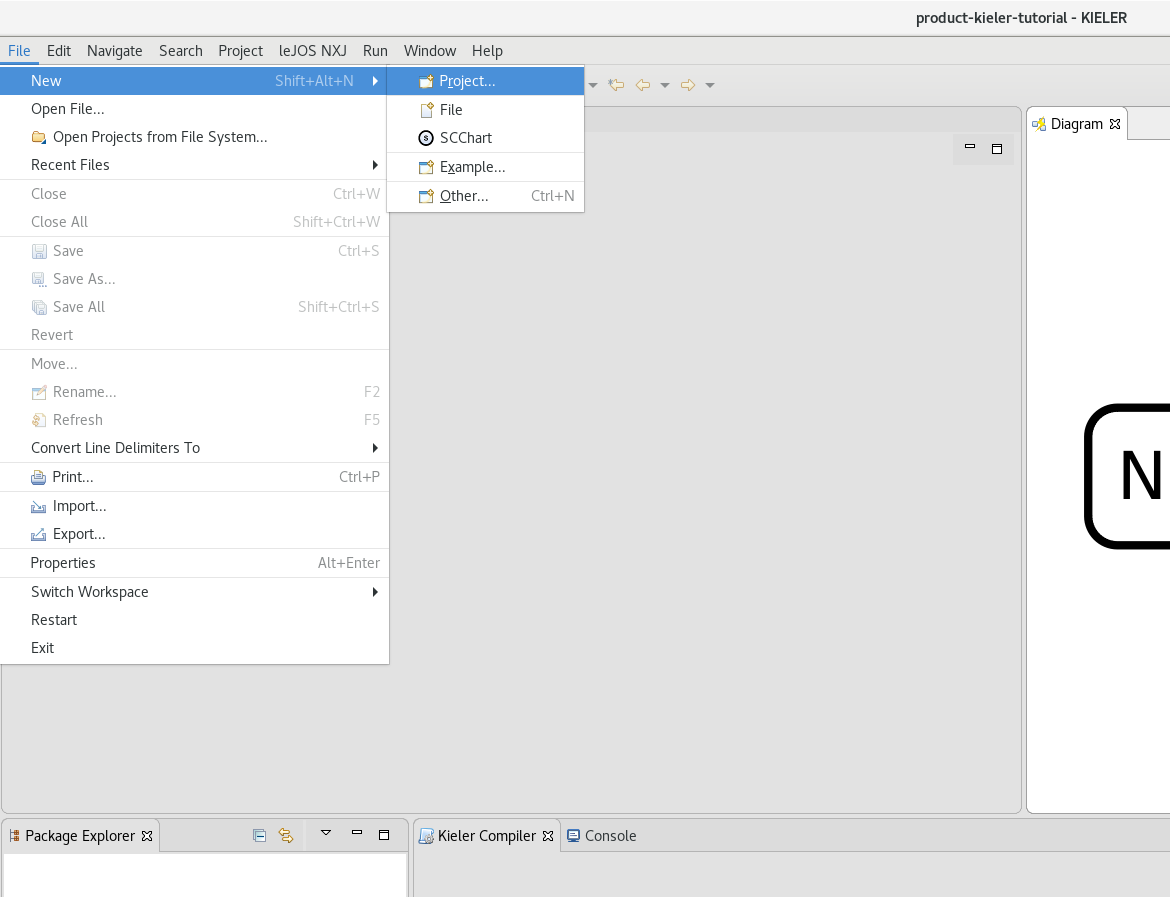
Dismiss this "Welcome" tab. After that you'll be all set and KIELER should look like this:
![]()
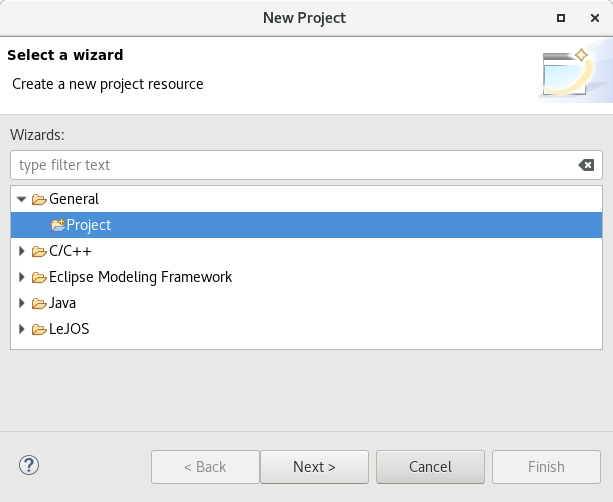
In order to prepare modeling, we must create a project. Right-click on the File entry of the top menu bar, select New and click on Project.
Select a Project in the General folder and click on next, then enter a project name, here Example, and click on Finish.
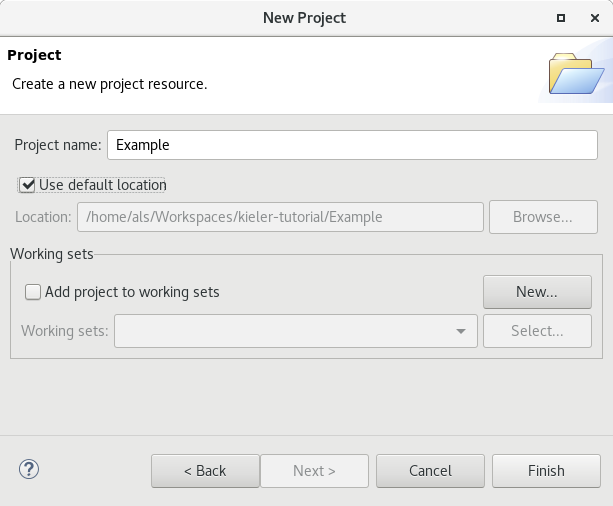
Now you have a project where you can create and model your SCCharts.
Modeling SCCharts
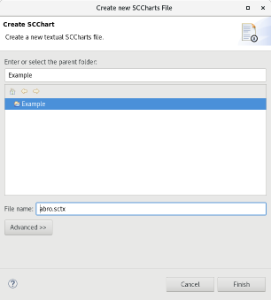
To create a new SCChart, you first need to create a new file. Click on File → New → File in the top menu, similar to creating a new project.
Select your project (where you want to create the new file) and set a file name, here abro.sctx. Make sure you use the .sctx file extension, this is necessary to enable the SCCharts language support for this file.
A new editor tab will automatically open and you can start modeling your SCCharts.
For this example you may copy paste the following code for the ABRO SCChart into your editor. You can find further examples and an overview about the SCCharts syntax in the sibling pages of this wiki.
scchart ABRO {
  input bool A, B, R
  output bool O

  initial state ABO {
    entry do O = false

    initial state WaitAB {
      region {
        initial state wA
          if A go to dA

        final state dA
      }

      region {
        initial state wB
          if B go to dB

        final state dB
      }
    }
    join to done do O = true

    state done
  }
  if R abort to ABO
}
When you press the save button (or Ctrl+S / CMD+S) the model is saved and the diagram view on the right automatically updates and presents the graphical representation of your ABRO SCChart.
Compiling SCCharts
COMING SOON
Simulating SCCharts
COMING SOON
Overview
Content Tools