The Statecharts formalism, proposed by of David Harel in 1987, extends Mealy machines with hierarchy, parallelism, signal broadcast, and compound events and is a well known approach for modeling control-intensive tasks. SyncCharts, the natural adoption of Statecharts to the synchronous world, were introduced almost ten years later. A SyncChart can be seen as the graphical notation for the synchronous Esterel language. SyncCharts and Esterel are used to describe reactive systems and so are SyncCharts. Following the synchrony hypothesis the reaction is computed tick wise and the computation itself does not take any time. This means that the generated output computed to an input in one tick instance is visible in this same instance. Because the output might have an impact on the computation itself, the computation proceeds until the system's variables reach a defined value.
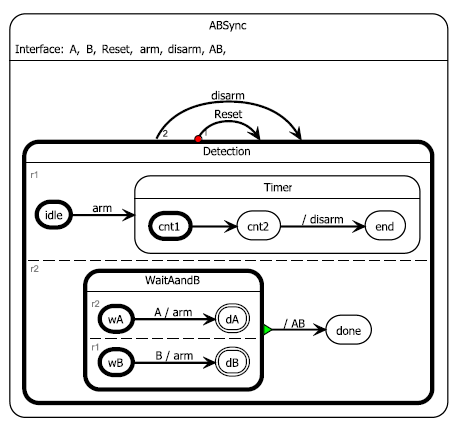
Example SyncChart from Charles André, Computing SyncCharts Reactions, 2003
Projects
In the context of KIELER there are several projects that relate to SyncCharts:
- The Thin Kieler SyncCharts Editor (ThinKCharts)
- Textual SyncCharts (KITS)
- Semantics (Simulation and Code Generation from SyncCharts)
References
Documentation of SyncCharts: C. ANDRÉ: Semantics of SyncCharts, Technical Report RR2003-24, ISRN I3S/RR-2003-24-FR, I3S, Sophia Antipolis, April 2003, 76 pages. http://www.i3s.unice.fr/%7Eandre/CA%20Publis/SSM03/RR200324.pdf
Overview
Content Tools