The Kick-Off will take place on April, 20th 2021 at 1:45 PM in our Zoom room. If you want to participate, please write a mail to nre@informatik... to get the link and register in the StudiDB. We will use Discord/Zoom or BigBlueButton for our meetings.
Inf-MP-ES: Masterprojekt Echtzeitsysteme/Eingebettete Systeme (Google Maps for Models/Incremental Model Views)
Welcome!
Welcome to the Confluence Wiki of the Masterprojekt offered by the Real Time and Embedded Systems group on the topic of Google Maps for Models/Incremental Model Views, henceforth referred to as the Browsing Project. What this Wiki is all about:
- It's the place where we post important information on the project, such as due dates and similar information.
- It's also the place where we post or link to tutorials. You will spend the first part of the project working through the tutorials before starting your individual projects.
- And finally, it's the place where each group will document their project.
About the Browsing Project
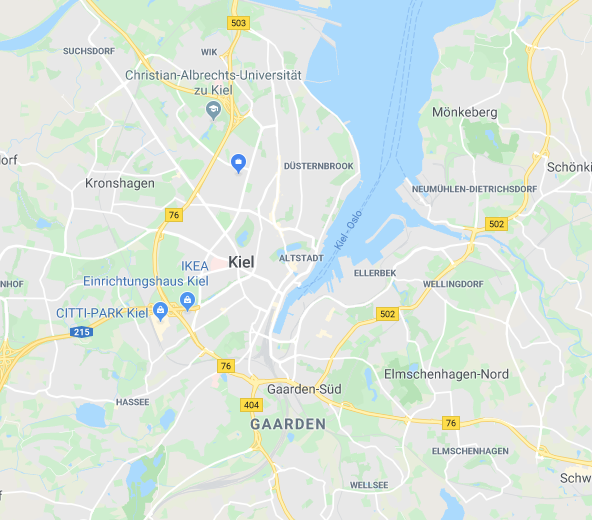
We all know and love how the information in Google Maps is presented while browsing. When looking at a country, only central points of interest such as big cities, rivers, country borders and streets connecting everything are highlighted in an intuitive way. If a user wants to know more about a specific area, they just zoom in and more information gradually pops into view while keeping the visible information always at a level of interest of that area. The shown map is just a filtered visual model of everything in the world presented in a context dependent way to the user. Another part is it being very user-friendly and reactive, only loading and showing relevant data, whereas the entire model (a map of the whole world) is much bigger.
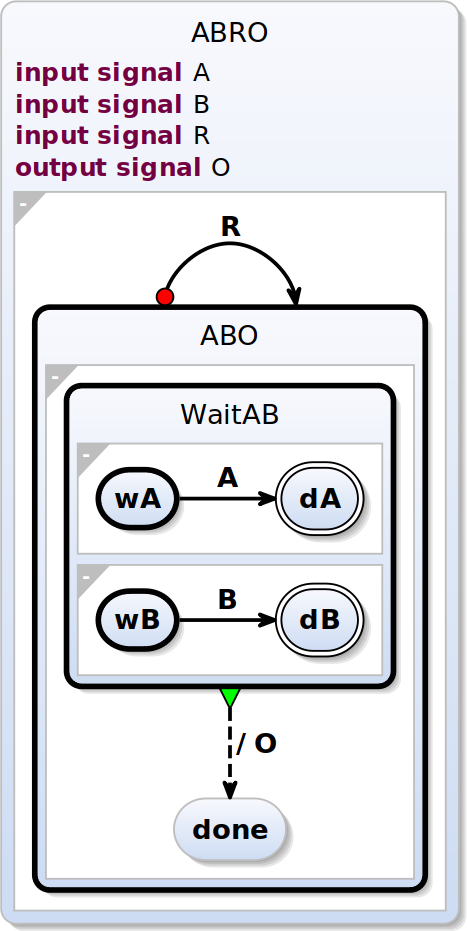
We use other models with a lot of information where our current technology stack and approach of visualizing diagrams comes to its limits when browsing very large models. As our current approach always generates graphs bottom-up and in their entirety, performance degrades quickly with growing model sizes. With this project we want to identify how the concepts for browsing of Google Maps can be applied to incremental generation of diagrams models when using the Visual Studio Code-alike technology Theia, its diagram framework Sprotty, a framework for automatic diagram generation called KLighD and automatic layout of the diagrams with ELK.
This project is done in a practical laboratory course at the Christian-Albrechts University of Kiel in the Department of Computer Science within the Real-Time and Embedded Systems Group.
Contact us:
The project is supervised by the following university staff. Please contact us if you have questions regarding the project.
- Prof. Dr. Reinhard von Hanxleden (rvh@informatik...)
- Niklas Rentz (nre@informatik...)
- Sören Domrös (sdo@informatik...)
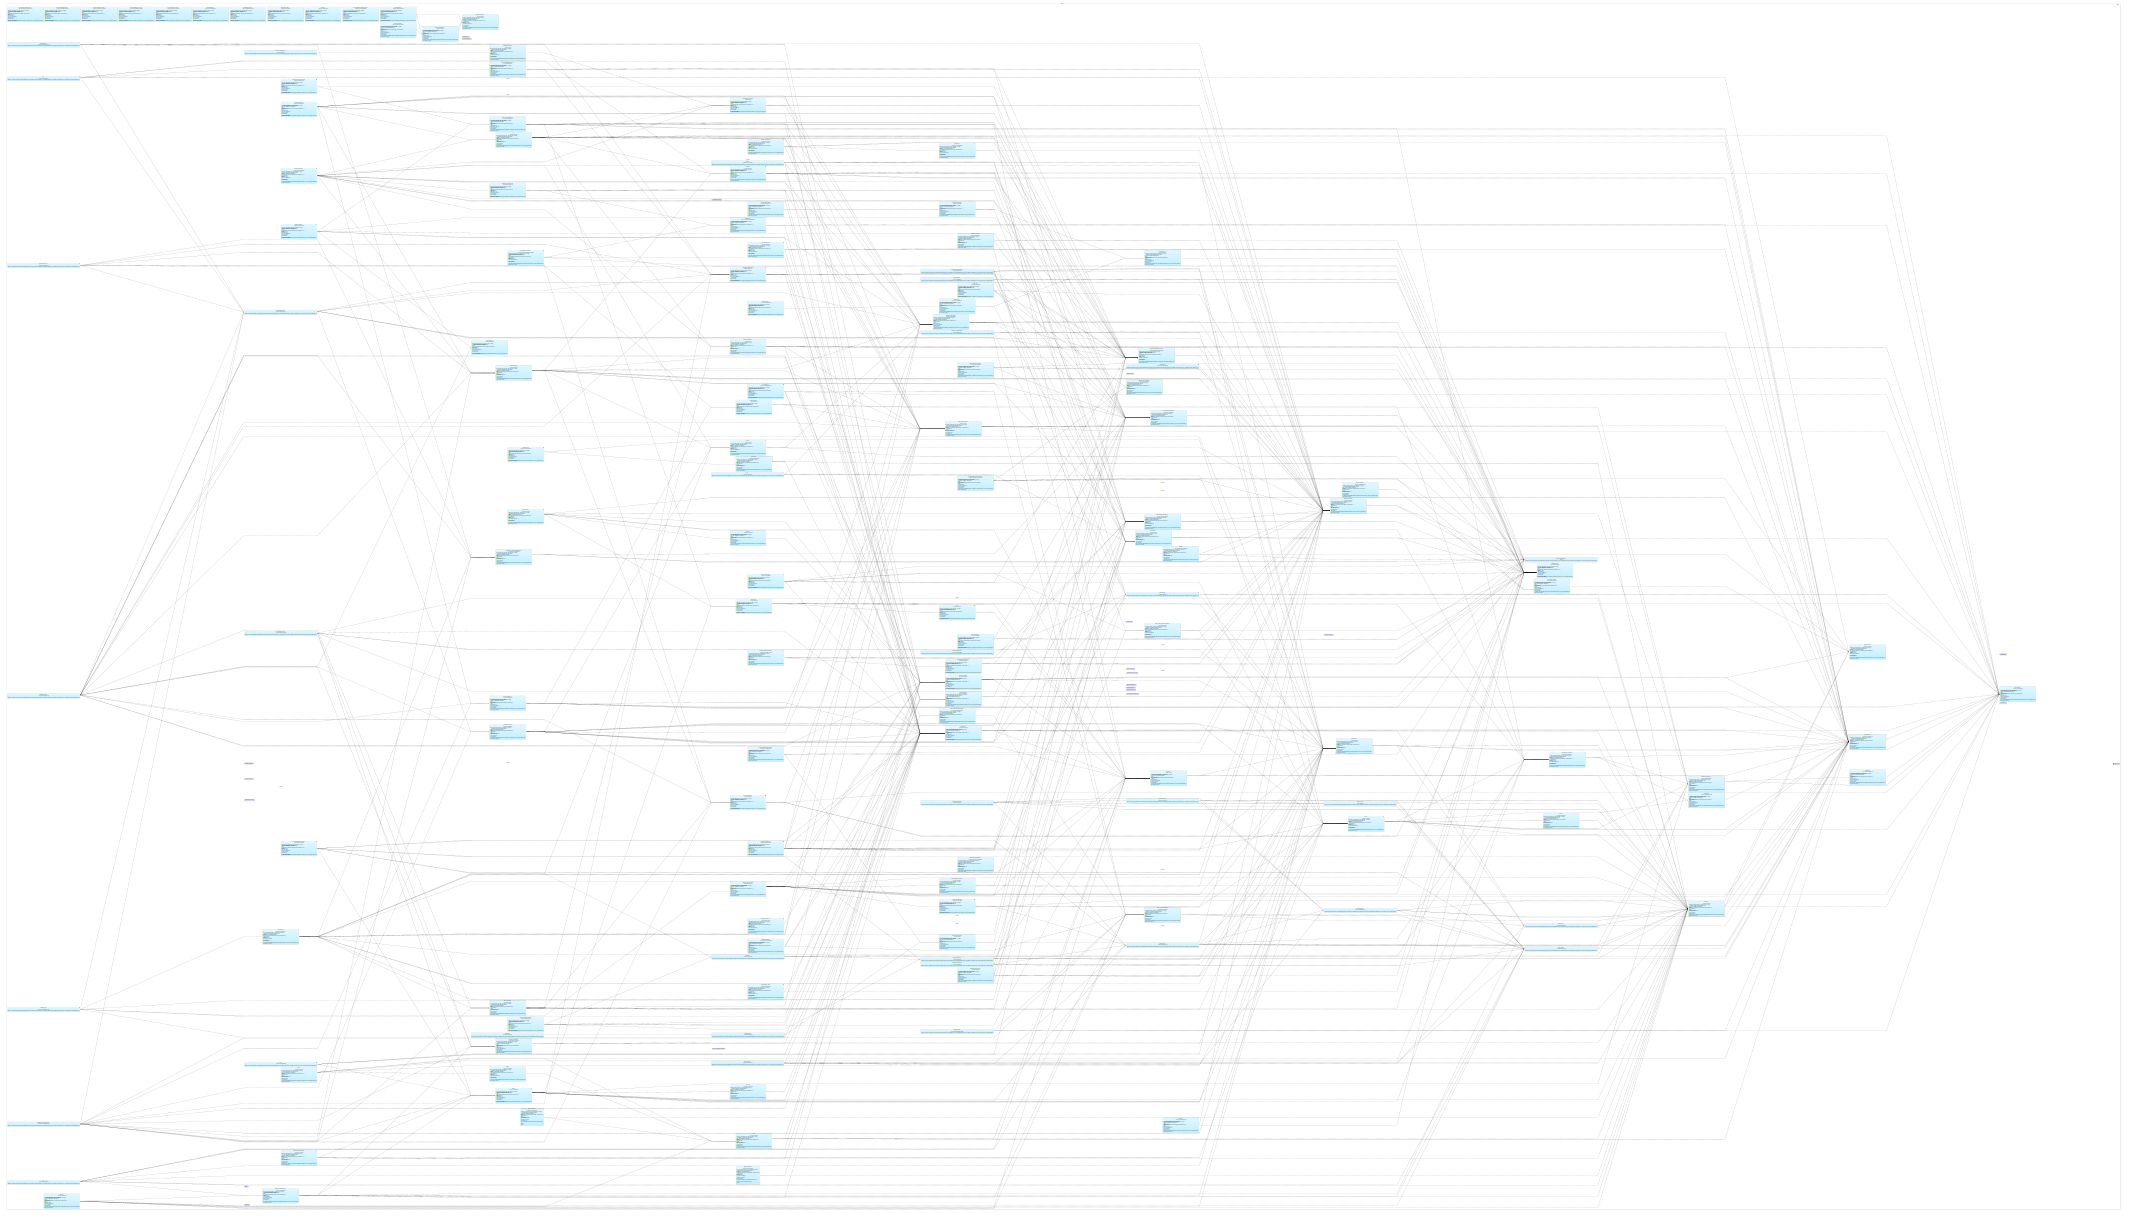
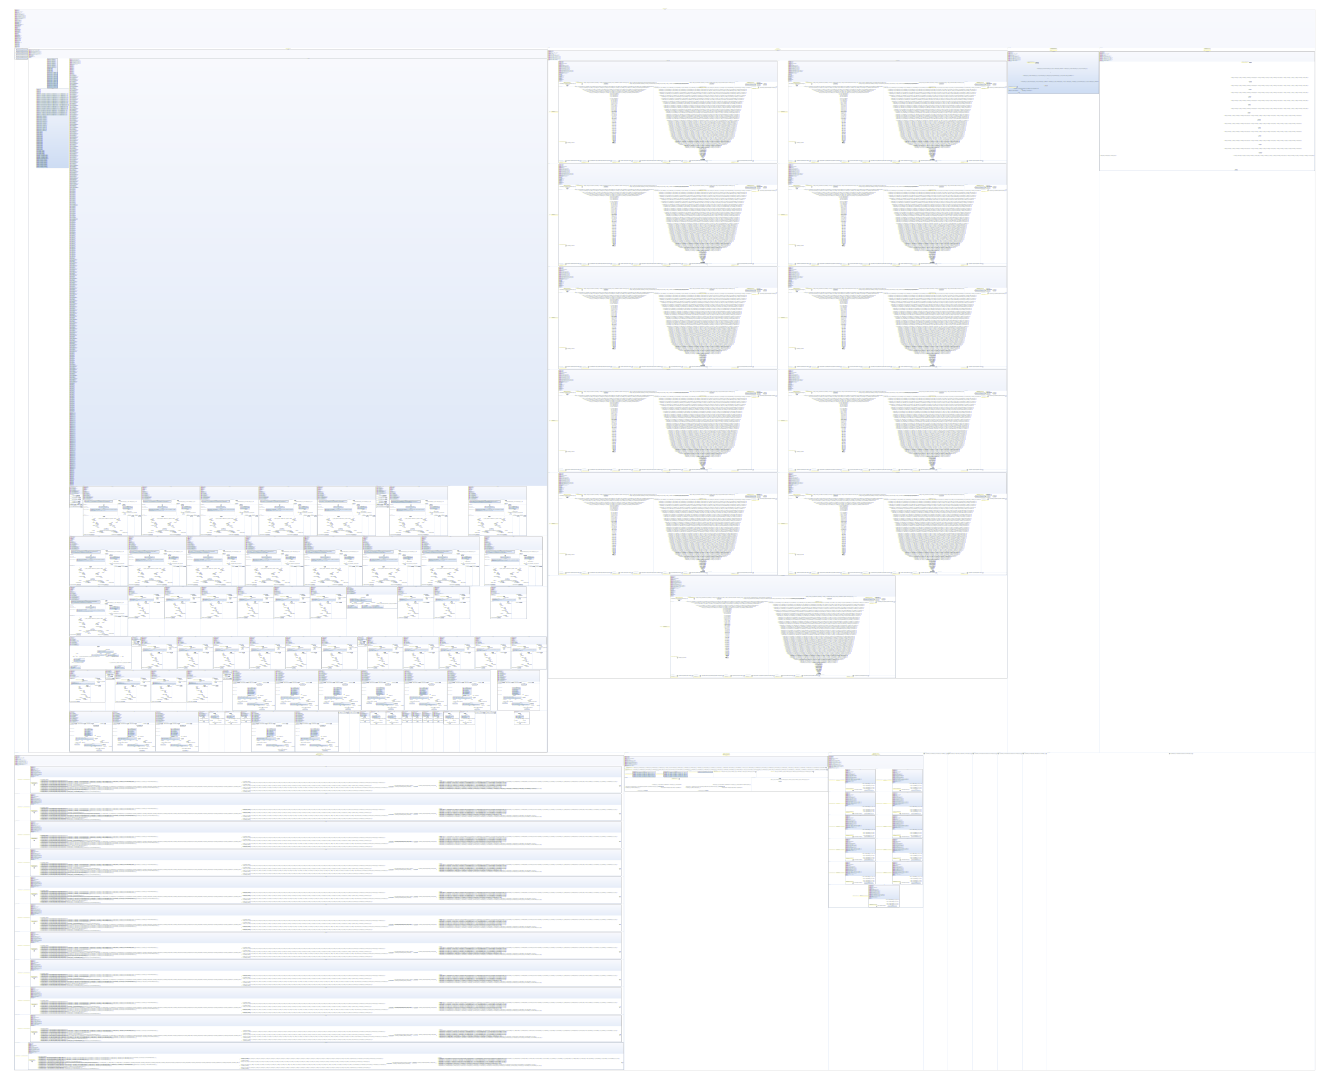
The graphs below show some automatically generated graphs, as generated with our current technology. Especially the bigger diagrams suffer from being non-readable at this scale and from bad performance and usability. We want to change that to the better!

Important Dates
| Date | Room | Event |
|---|---|---|
| April, 20th 2021 at 1:45 PM | Zoom (Mail me for the link) | Kick-Off Meeting |
Add Comment