Deprecated since 0.14
This article is deprecated. The described features are no longer available in current releases.
Version 0.13 RC1
This page is part of the SCCharts Editor 0.13 RC1 documentation. This page is still under construction. We are still in the process of creating the release candidate. Please excuse any missing or incomplete entry. We apologize for any inconvenience.
Visualize the Simulation State with an SVG Image
Overview
The Data Pool View shows all variables present in the simulation. However it can be difficult for humans to interpret the state of a model when having only a load of numbers and variables. The former KIELER Environment Visualization (KEV) had been developed to display the simulation state in a more pleasant way. Therefore KEV loaded an SVG image and could manipulate it to reflect the state of the simulation.
This approach has been developed further in KIELER Visualization (KiVis) to integrate with the new simulation. Furthermore a DSL for kivis files has been created to configure how the SVG image will be manipulated.
Besides displaying the state of the simulation, KiVis is also able to interact with the simulation, e.g., when an element in the simulation is clicked. Thus buttons in the SVG image can be created to set variables in the simulation, or to step, stop, play and pause the simulation.
Creating an SVG Image
In this section the open-source vector graphics program Inkscape is used to illustrate how to create an SVG image that can be used with KiVis.
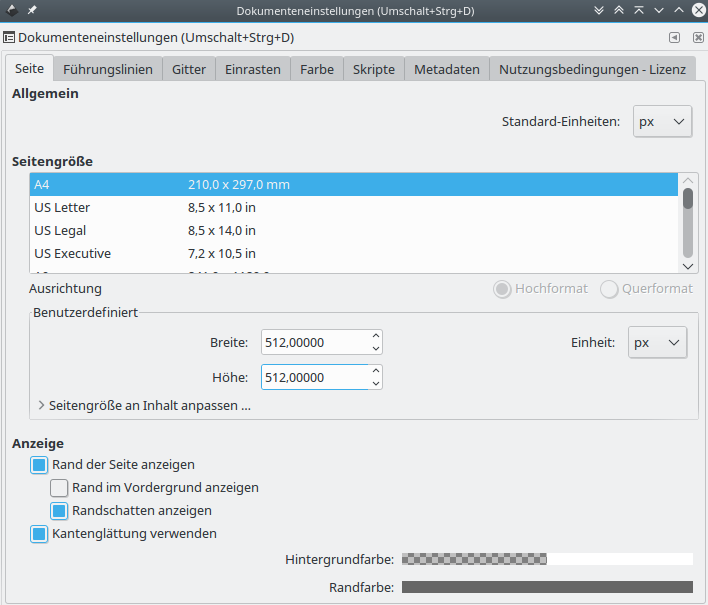
It is advisable to first set the document size. In Inkscape this is done under File > Document Settings. In the image below the size is set to 512x512 px. This setting defines the coordinate system of the file, which is useful when animating, e.g., movement later. Anyhow, SVG images can be scaled to any size.
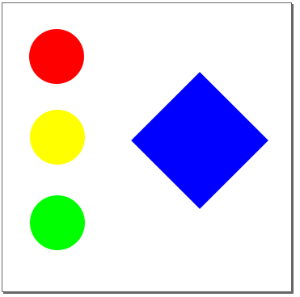
Afterwards three circles and a rectangle have to be created. The circles will simulate the red, green and yellow lights of a traffic light, and thus are colored accordingly. The rectangle will show the same information, but using different animations.
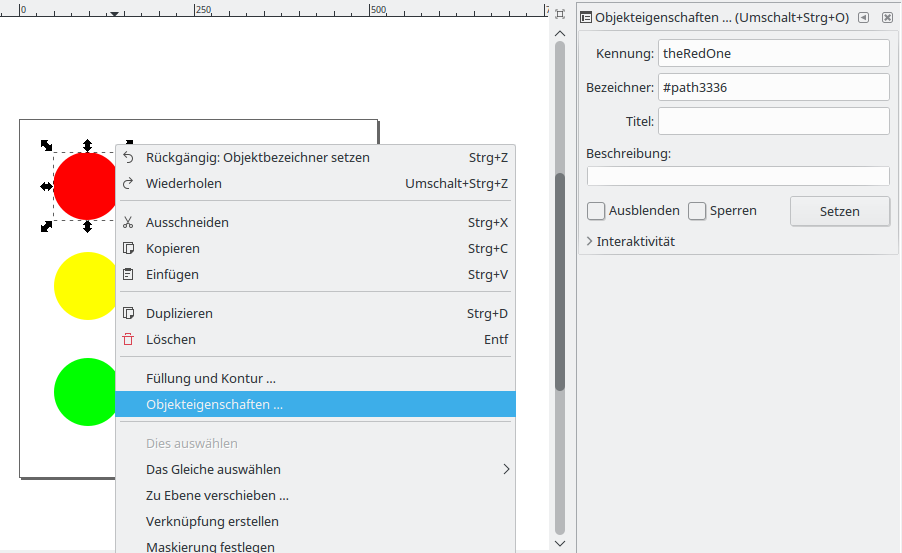
After the elements of the image have been created, it is necessary to give elements that should be animated a unique name. This can be done in Inkscape by selecting the object and using Right click > Object properties. In the window that opens, an id can be set in the first field (the value without leading hash, labelled "Kennung" in german). Name the circles according to their color, theRedOne, theYellowOne and theGreenOne. The rectangle gets the id theRect.
Note that a new id has to be applied using the button in the object properties window!
Finally, save the result as Inkscape-SVG (recommended) or Normal-SVG and name it Lights.svg.
Groups and Layers
SVG is an XML format. Elements can be grouped and layers can be created which forms a hierarchy. When working with groups and layers in Inkscape, it can be useful to work with the XML-Editor (Ctlr+Shift+X).
Flowed Text
In Inkscape it is possible to create a flowed text element, which is text that wraps its content inside a user defined area. However this is not a fully specified feature in SVG and thus not supported by many SVG viewers. For instance Gimp displays these elements as black box and Firefox does not display them at all.
KEV and the newer KiVis uses Apache Batik for SVG rendering, which also does not support flowed text. If you encounter issues with text object, try to convert them to simple text in Inkscape, via Text > Convert to normal text.
For more information see also the Inkscape FAQ for this topic: http://wiki.inkscape.org/wiki/index.php/Frequently_asked_questions#What_about_flowed_text.3F
Text Colors
Sadly the Batik SVG Renderer that is used in KIELER does not handle text colors as well as Inkscape does. When setting the fill color directly on a text element in Inkscape, it will not be displayed in the Simulation Visualization View. The text will be black.
However there is a simple workaround: Select the text objects that should be colored, group them (Ctrl + G), then set the fill color on this group. The child elements will inherit the color and (for whatever reason) this does also work in Batik.
Creating a Configuration File
The configuration depends on the model to be simulated. In the following a simple kivis file is shown for the example model below.
Example KiVis File
image: "Lights.svg"

animate theRect {
  apply color using showLight {
    fillColor: 0 is "red", 1 is "yellow", 2 is "green"
  }
}

animate theRedOne {
  apply color using showLight {
    opacity: 0 is 1, 1-2 is 0
  }
}

animate theYellowOne {
  apply color using showLight {
    opacity: 0 is 0, 1 is 1, 2 is 0
  }
}

animate theGreenOne {
  apply color using showLight {
    opacity: 0-1 is 0, 2 is 1
  }
}
This configuration will animate the svg element with the id theRect. The value of the variable showLight is used to determine the attributes of the color animation, in this case the fillColor attribute is set. The value 0 of showLight is mapped to the value "red" for the attribute, 1 is mapped to "yellow" and 2 is mapped to "green".
The animations of theRedOne / theYellowOne / theGreenOne is used to show this element (opacity is 1) when the showLight variable is 0 / 1 / 2 and to hide them otherwise (opacity is 0). This represents a very simple traffic light.
When writing a visualiation configuration, code completion can be used to show the available attributes of an animation. In the following the available animations are explained.
Animation Handler Base Class
The attributes of this class are also available for all other animation handlers and provide generic features.
| Attribute | Domain | Description |
|---|---|---|
| recursive | Boolean | Applies the animation to this element as well as all child elements recursively. This might be useful, e.g., to set the opacity of an element and also in its children and their children. |
Color Animation
It is used to change the appearance of elements. The fill color, stroke color and with as well as opacity can be changed.
| Attribute | Domain | Description |
|---|---|---|
| fillColor | String, either a color name of predefined colors, or a hexadecimal rgb color | Sets the fill color |
| fillOpacity | Float, ranges from 0 (fully transparent) to 1 (fully visible) | Sets the opacity of the filling |
| strokeColor | Same as fillColor | Sets the color of the outline / stroke |
| strokeOpacity | Same as fillOpacity | Sets the opacity of the outline / stroke |
| opacity | Same as fillOpacity | Sets the overall transparency |
Text Animation
This animation can be used for text objects in the SVG to set the font and text.
| Attribute | Domain | Description |
|---|---|---|
| text | String | Sets the text of the element |
| fontSize | Integer | Sets the size of the text element |
| fontFamily | String, name of an installed font (e.g. "Arial Black" or "serif") | Sets the font family |
Move Animation
This animation changes the position of an SVG element.
| Attribute | Domain | Description |
|---|---|---|
| x | Float | The x coordinate relative to the original position |
| y | Float | The y coordinate relative to the original position |
| absolute | Boolean | Determines if the given position is absolute or relative to the element's original position |
Rotate Animation
This animation changes the rotation of elements.
| Attribute | Domain | Description |
|---|---|---|
| angle | Integer | The angle in degrees that the object should be rotated |
| anchorX | Float, 0 to 1 | Relative position inside the SVG element where the anchor point of the rotation will be. 0 is at the left side, 1 is at the right side. Default is 0.5, which is the middle. |
| anchorY | Float, 0 to 1 | Relative position inside the SVG element where the anchor point of the rotation will be. 0 is at the top side, 1 is at the bottom side. Default is 0.5, which is the middle. |
Walk Path Animation
This animation is used to position SVG elements on SVG paths. Therefore the start value of the path and the end value of the path have to be defined. The position is then interpolated linearly between start and end.
This is a powerful animation to position SVG elements, because the position can be drawn as path in the svg itself.
| Attribute | Domain | Description |
|---|---|---|
| name | String | The id of the path in the SVG image |
| start | Float | The start position of the path. When the position value is the same as the value of this attribute, the object will be position at the beginning of the path. |
| end | Float | The end position of the path. When the position value is the same as the value of this, the object will be position at the end of the path. |
| length | Float | The length of the path. Can be used instead the absolute end position. In this case the end position is calculated as |
| position | Float | Used to set a fixed position on the path. Normally the position is taken from a variable in the simulation data pool, but it can also be set to a fixed value with this attribute. The value should be between start and end of the path |
| autoOrientation | Boolean, true / false | Determines if the object should also align its rotation to the path |
| angleOffset | Integer | When autoOrientation is true, this offset in degrees is added to the calculated rotation on the path. For example if the element is facing with in the wrong direction when it is walking the path, an offset of 180 can be used to turn it. |
| angle | see rotate animation | see rotate animation |
| anchorX | see rotate animation | see rotate animation |
| anchorY | see rotate animation | see rotate animation |
Attribute Values
Attributes can be set to a single constant value, a single variable in the simulation or using a more complex mapping from variable values to attribute values as shown in the example below.
image: "Lights.svg"

animate theRect {
  apply color using showLight {
    stroke-color: 0 is "green", 1 is "blue", 2 is "orange"          // The attribute is set depending on the value of the variable in the using declaration
    stroke-opacity: 0-2 is 1-20                                     // The attribute is set depending on the value of the variable in the using declaration and mapped linearly to the target domain
    stroke-width: showLight                                         // The attribute is set to the value of a variable in the pool
    fillColor: "red"                                                // The attribute is set to a constant value
  } if showLight >= 1
}
There are two keywords for mapping variable values to target values: others is used to match all other variable values that are not specified and define a target value for these. value refers to the current value of the variable in the using declaration.
image: "Lights.svg"

animate theRect {
  apply color using showLight {
    stroke-width: value                          // Set the attribute to the current value of the variable
    stroke-color: 0 is "red", others is "orange" // Define a target value for all other cases
    opacity: 0-1 is value, others is 0.5         // More complex example that uses both keywords
  }
}
Interaction with the Simulation
It is also possible to interact with the visualization. For the image that has been created above, a simple interaction could be configured as follows:
Interaction example
image: "Lights.svg"

animate theRect {
  apply color using showLight {
    fillColor: 0 is "red", 1 is "yellow", 2 is "green"
  } if showLight >= 1
}

perform on click from theRect {
  showLight = 1
  step simulation
} if showLight != 1
This illustrates that animations and interactions can be used with the same SVG element, which is theRect in this case.
The interaction that is setup in this example is a click listener for theRect. If the element with this id is clicked, the variable showLight will be set to 1 and the simulation will perform a macro tick. However this is only done when the condition holds. Thus the simulation will not be stepped, if the showLight variable already has a value of 1.
Color Functions
There are also pre-defined functions to interact with the visualization environment. In the following example the variables color, a, r, g and b are set to the corresponding color values of the pixel on position x and y in the svg image. The pixel position is determined by the document size of the svg, which can be defined for example in Inkscape (File > Document Properties).
image: "image.svg"

// Get the color of the pixel at position (x, y)
perform {
  color = getColor(x, y)
  a = getAlpha(x, y)
  r = getRed(x, y)
  g = getGreen(x, y)
  b = getBlue(x, y)
}

// Illustrate the position by moving an svg element there
animate theDot {
  apply move {
    x: x
    y: y
    absolute: true
  }
}
Example Model
Create an empty SCChart and fill it with the following content:
scchart TrafficLight {
    output int showLight

    initial state init
      go to init do showLight += 1; showLight = showLight % 3
}
This model will set the variable showLight successively to 0, 1 and 2.
see rotate animation
Overview
Content Tools