Modeling & Compiling SCCharts with KIELER
This tutorial should guide you if you like to model SCCharts with KIELER and use the circuit based software synthesis path as explained in our [1] PLDI'14 submission. We will show you how to
1. Download & Start KIELER,
2. Model an SCChart, and
3. Compile an SCChart.
We will use a simple example here in order to illustrate the process. Please refer to the SCCharts superpage for the project status and known limitations. If you are interested in the source code you can find instruction how to download and compile it here: Getting Started.
See a list of the evaluated examples at the end.
[1] PLDI submission: http://rtsys.informatik.uni-kiel.de/~biblio/downloads/papers/pldi14-submitted.pdf
In addition to the step-by-step tutorial guide below we also captured a video that shows each of the explained steps (of Section 3.1.):

Download location: http://rtsys.informatik.uni-kiel.de/~kieler/files/pldi14/sccharts.swf
1. Download & Start KIELER
Download a suitable KIELER version for your operation system. The zip bundles are fully compiled and ready-to-run, they do not need any further installation process. Just save and extract them to/at the location of your choice and start the KIELER executable.

Download location: Downloads#SCChartsEditorandCompiler
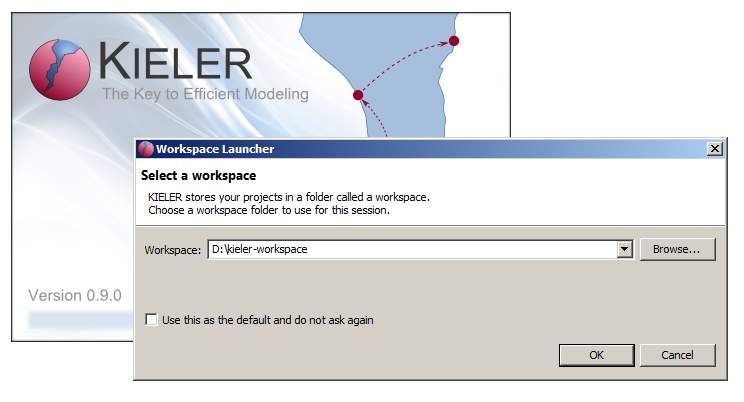
When you start the KIELER executable, you probably need to set a (new) workspace location of your choice. (Click on the images to enlarge them).
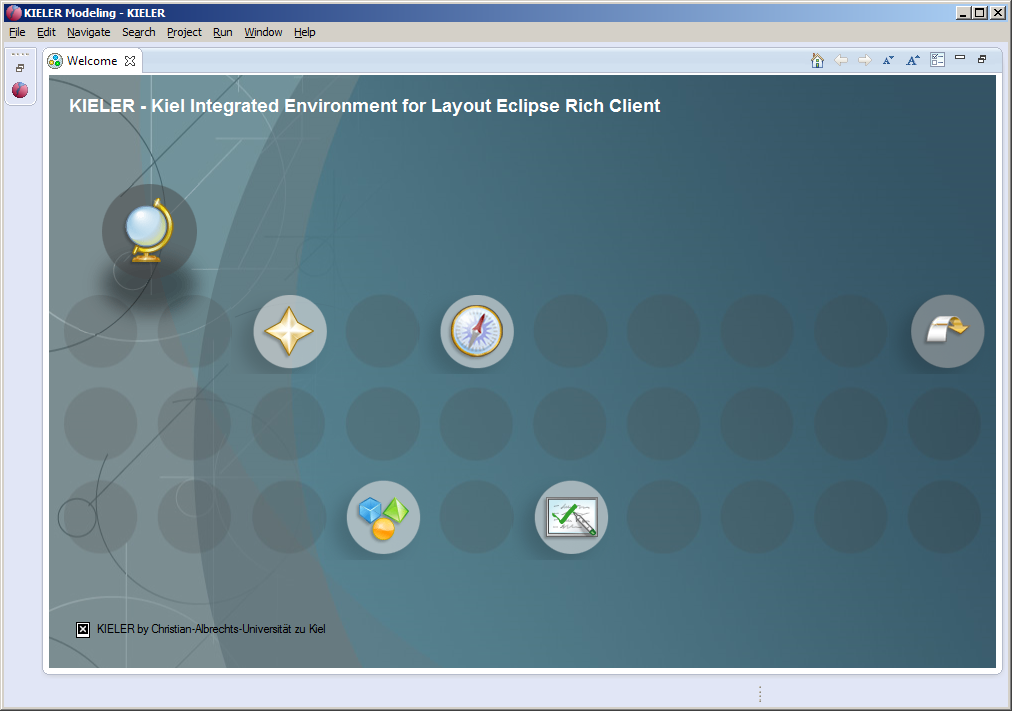
If you selected a new workspace location, you will see a welcome screen like this:
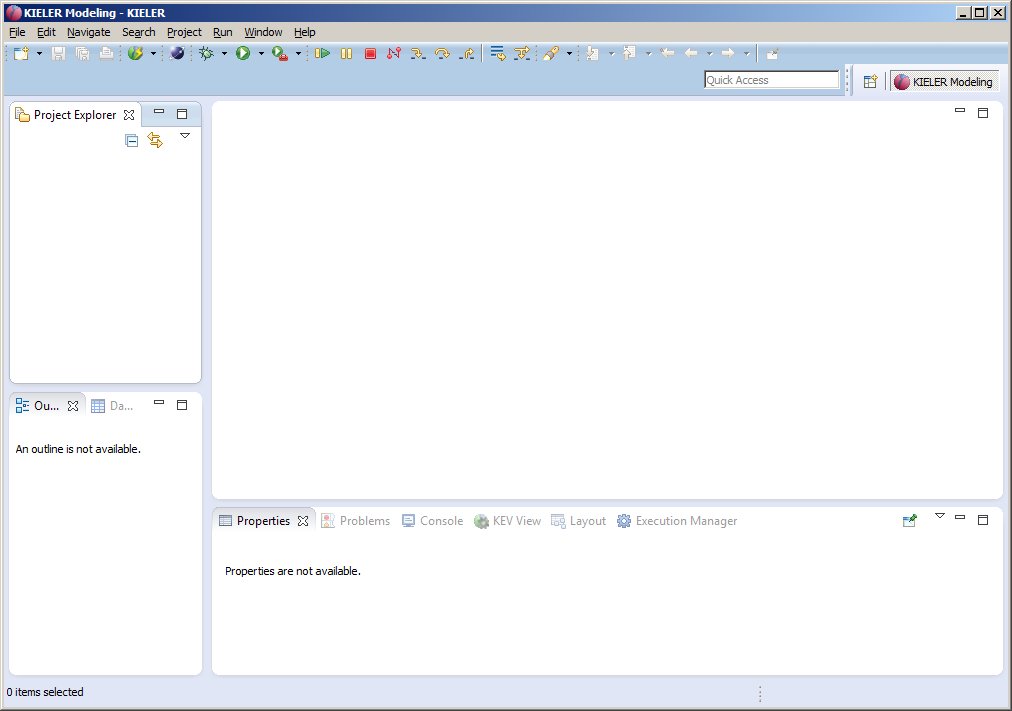
Dismiss this "Welcome" tab. After that you'll be all set and KIELER should look like this:
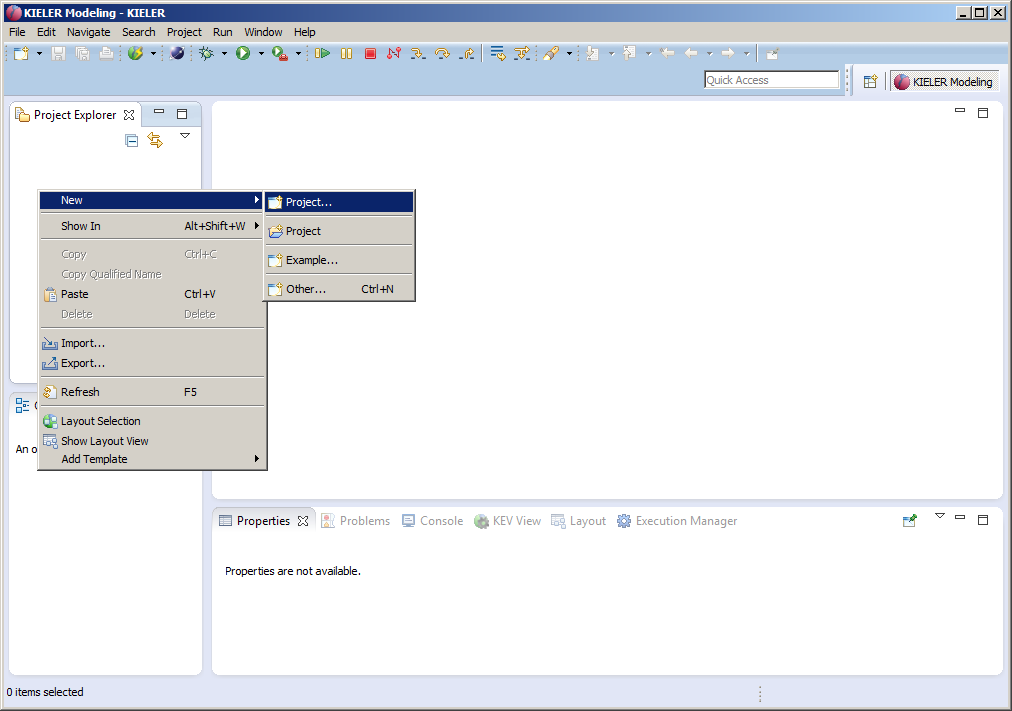
In order to prepare modeling, we must create a project. Right-click in the Project Explorer to do so.
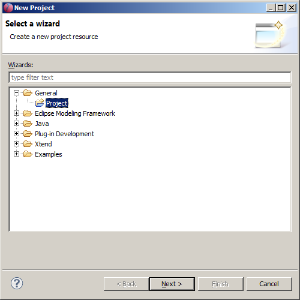
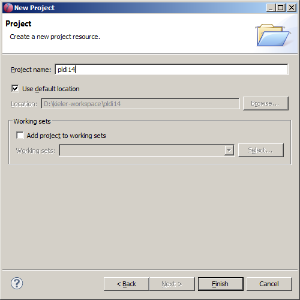
Select a General Project and click on next, then enter a project name, e.g. pldi14 and click on finish:
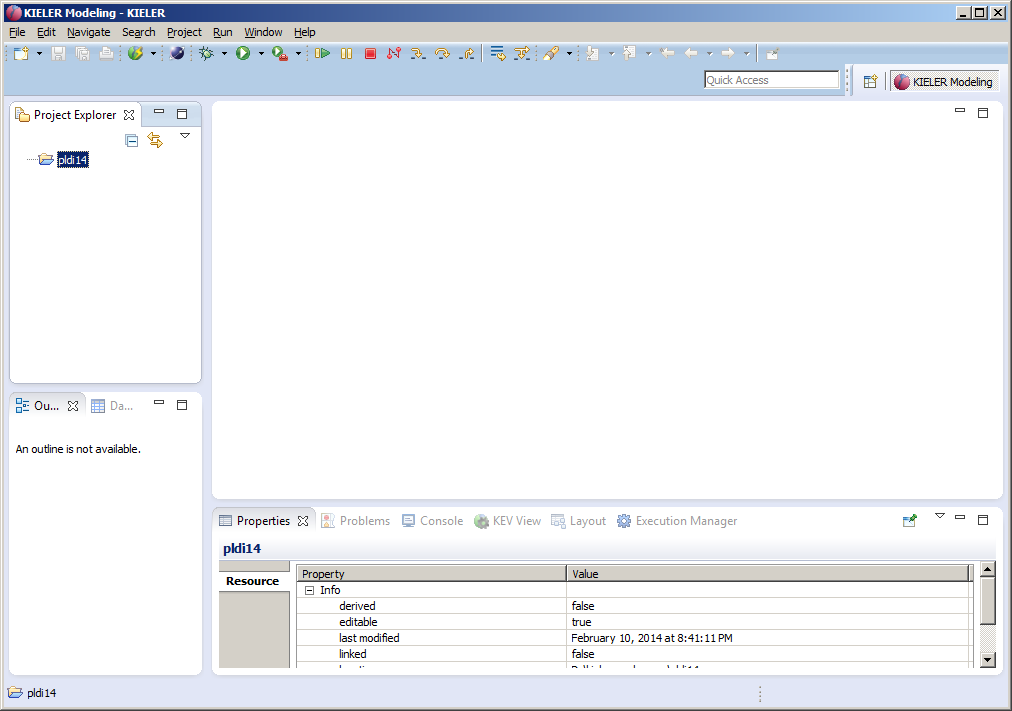
Now KIELER should look like this:
Now you can proceed in modeling an SCChart as explained below.
2. Model an SCChart
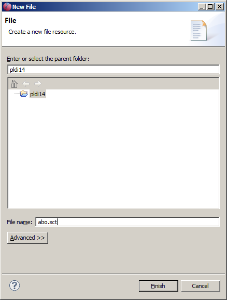
Right-click on a project and create a (text) File:
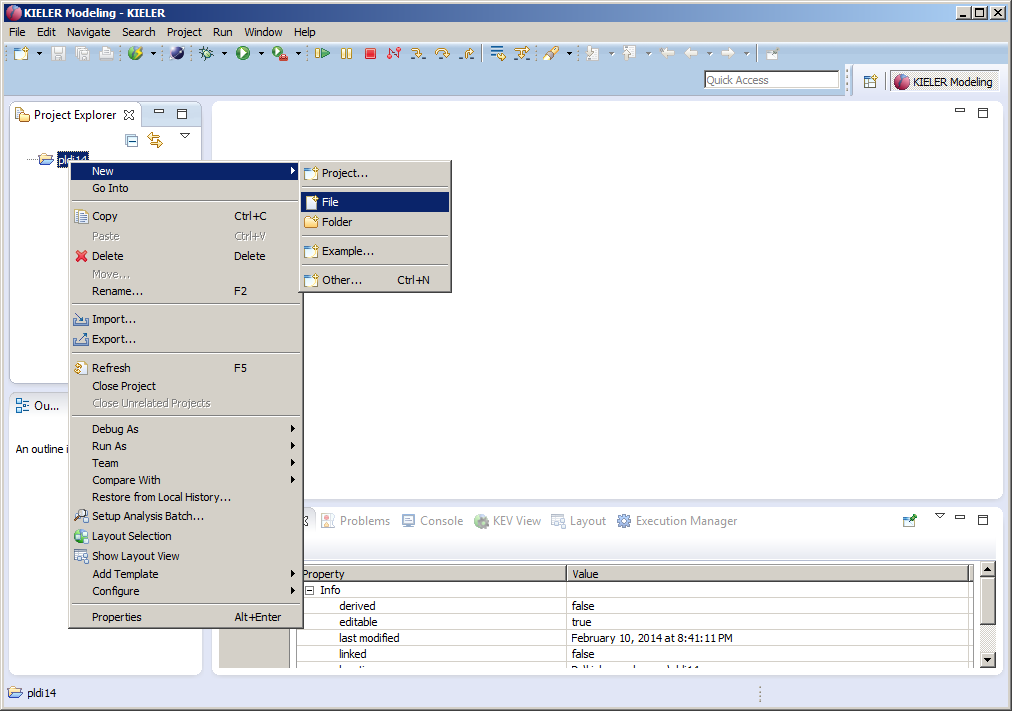
Name it abo.sct:
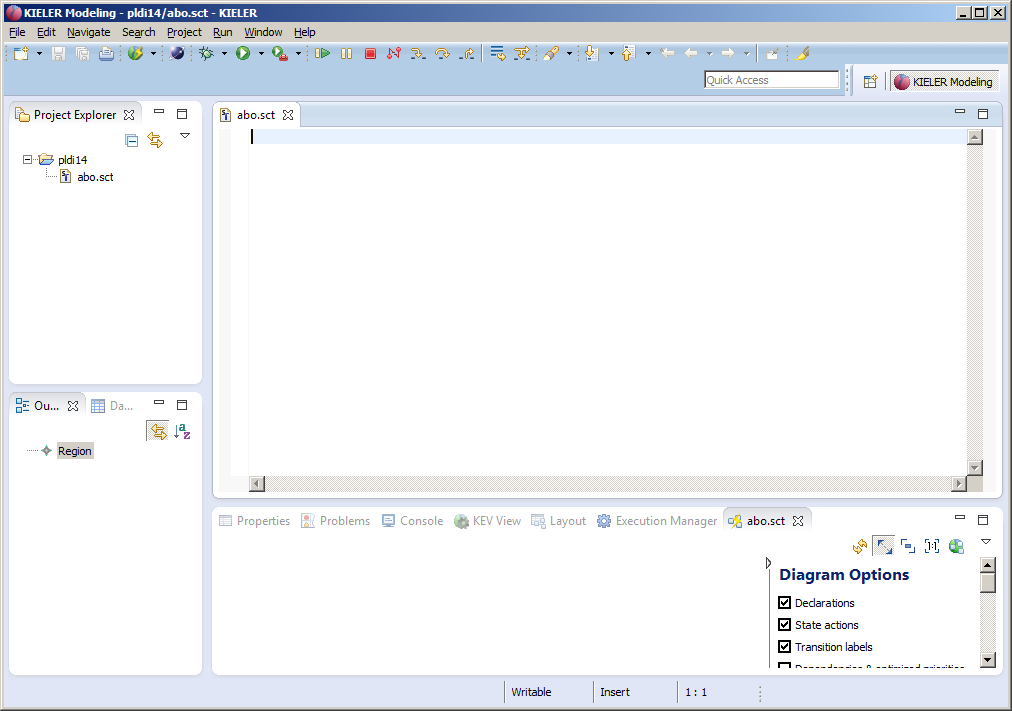
SCT is a textual description language for SCCharts. Due to space limitations SCT is not documented in the PLDI paper, but examples can be found here. Also the code completion functionality of the textual editor for SCT is very helpful. It can be invoked by pressing <Ctrl> + <Space>. It will list all syntactically possible input according to the SCT/SCCharts meta model.
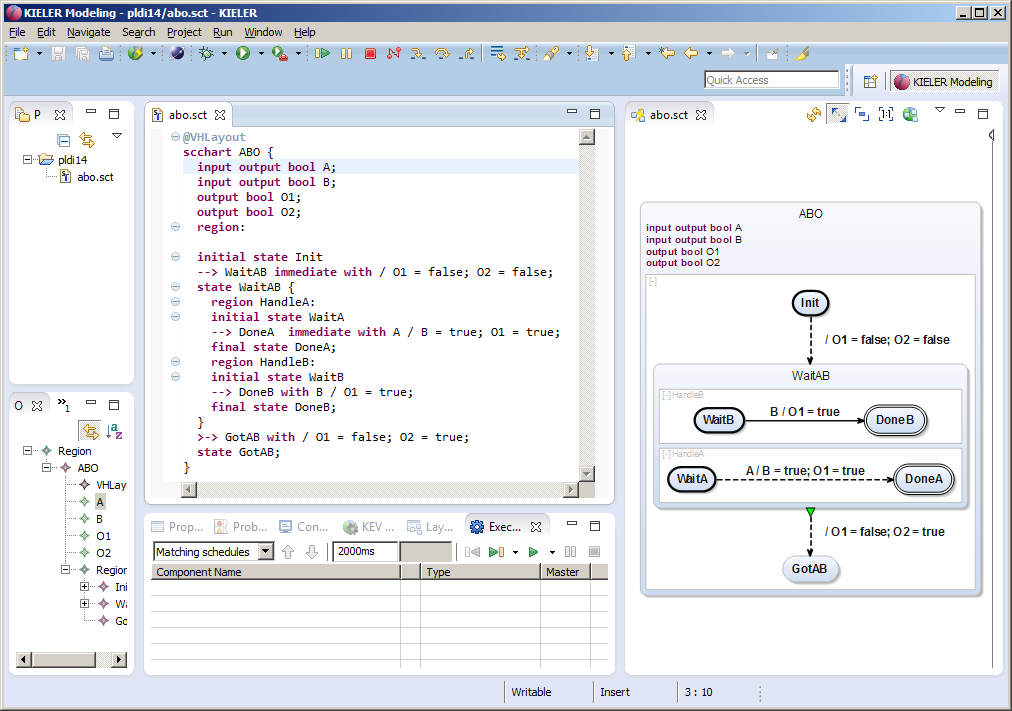
The textual SCCharts Xtext based editor (for *.sct files) will automatically be opened:
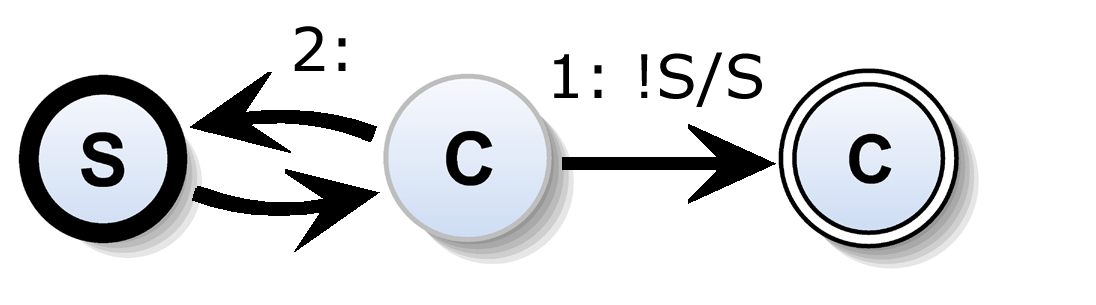
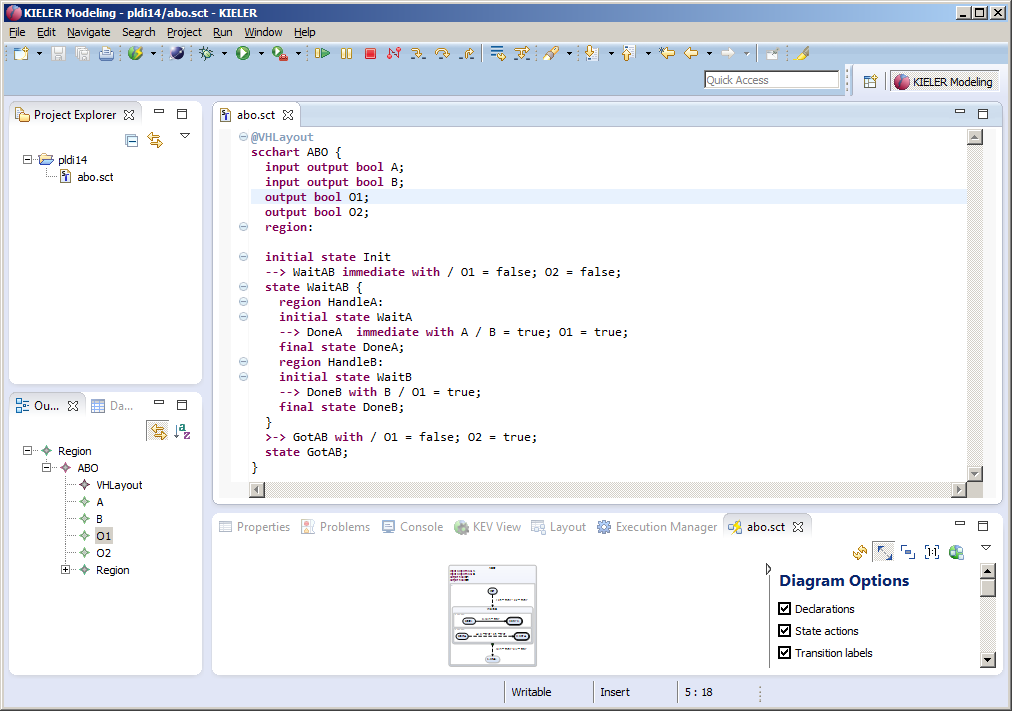
Now start modeling an SCChart. For example copy & paste the following sct code of ABO, the hello world of SCCharts (you can find more example models here, a description of the textual SCCharts syntax (SCT) can be found here):
abo.sct
@VHLayout
scchart ABO {
  input output bool A;
  input output bool B;
  output bool O1;
  output bool O2;
  region:

  initial state Init
  --> WaitAB immediate with / O1 = false; O2 = false;
  state WaitAB {
    region HandleA:
    initial state WaitA
    --> DoneA  immediate with A / B = true; O1 = true;
    final state DoneA;
    region HandleB:
    initial state WaitB
    --> DoneB with B / O1 = true;
    final state DoneB;
  }
  >-> GotAB with / O1 = false; O2 = true;
  state GotAB;
}
As you save (Ctrl+S), KIELER will automatically draw the graphical SCChart diagram in a new KLigD view:
You may want to re-arrange views. Just drag the KLighD view to the right side:
You will now see how to generate a C tick function.
3. Compile an SCChart
There are currently three different ways to compile an SCChart. In the following we will explain all three. The oldest way is to apply transformations on SCCharts textual SCT files via the context menu. Unless you use an older version of KIELER where the other alternatives are not present you are NOT advised to use the context menu as there are more convenient compilation ways. A more integrated compilation is the one described in Section 3.2 where the KIELER Compiler Selection View is used. The most simple way to try the SCCharts compiler is to use the online compiler as explained in Section 3.3 which also explains how to use the compiler from a make file using the command line.
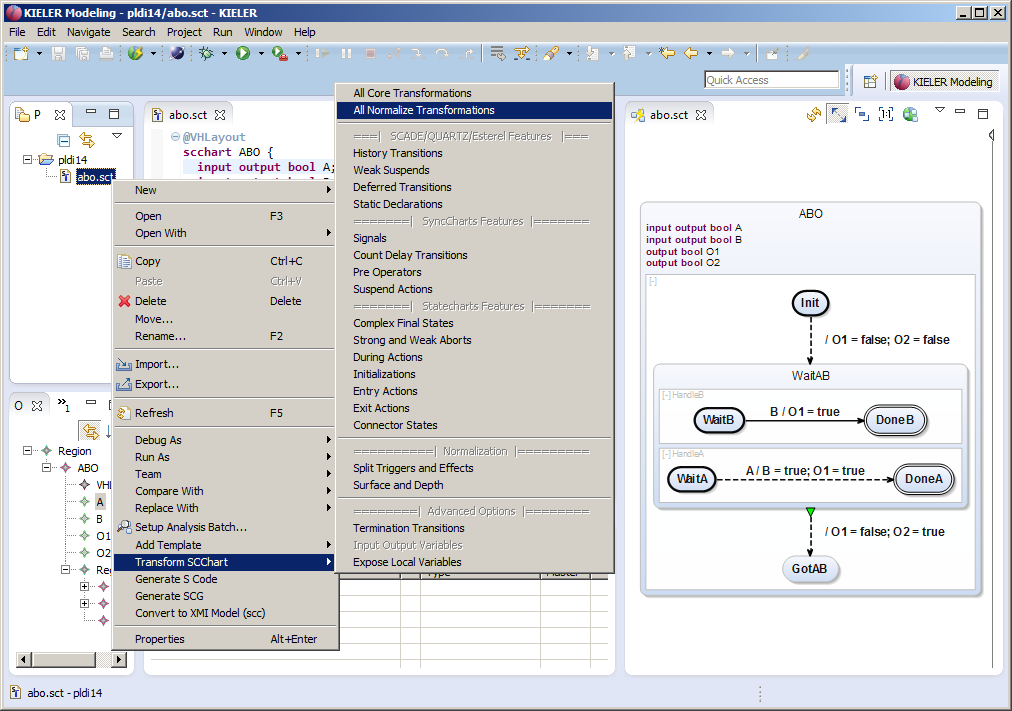
3.1 Alternative 1: Context Menu Transformations (deprecated)
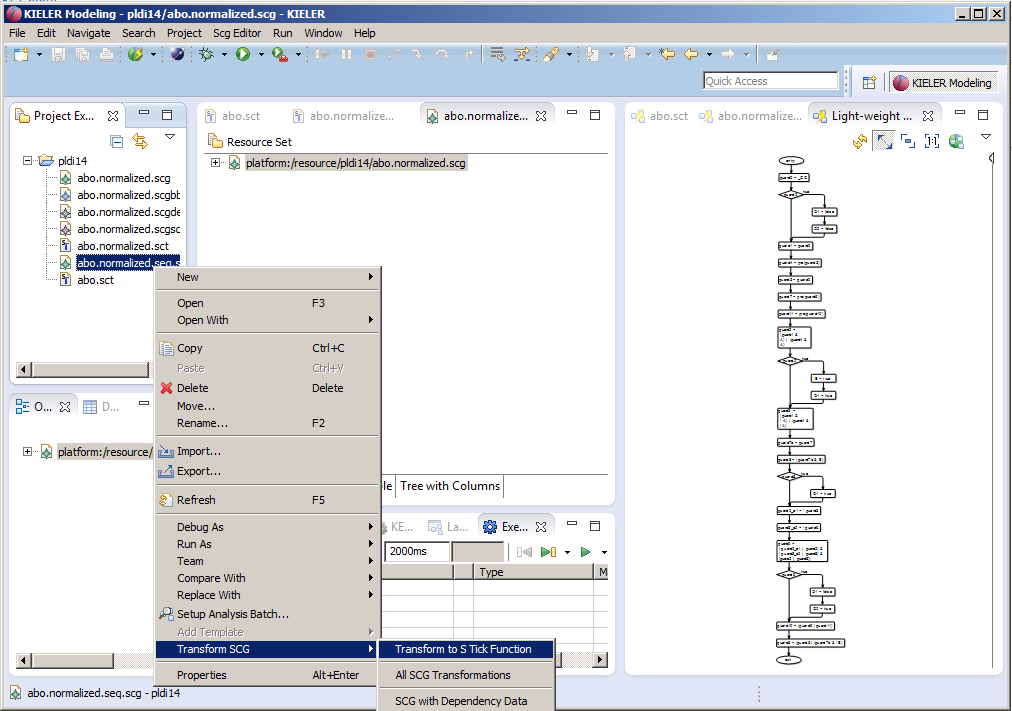
You can do several transformations on SCCharts (*.sct files). Just right click the file you want to transform in the project explorer and select the Transform SCChart sub menu. As abo is already a Core SCCart you do not need the core transformations. Click the All Normalize Transformations, this will do the Split Trigger and Effects and the Surface and Depth transformations together (in this order).
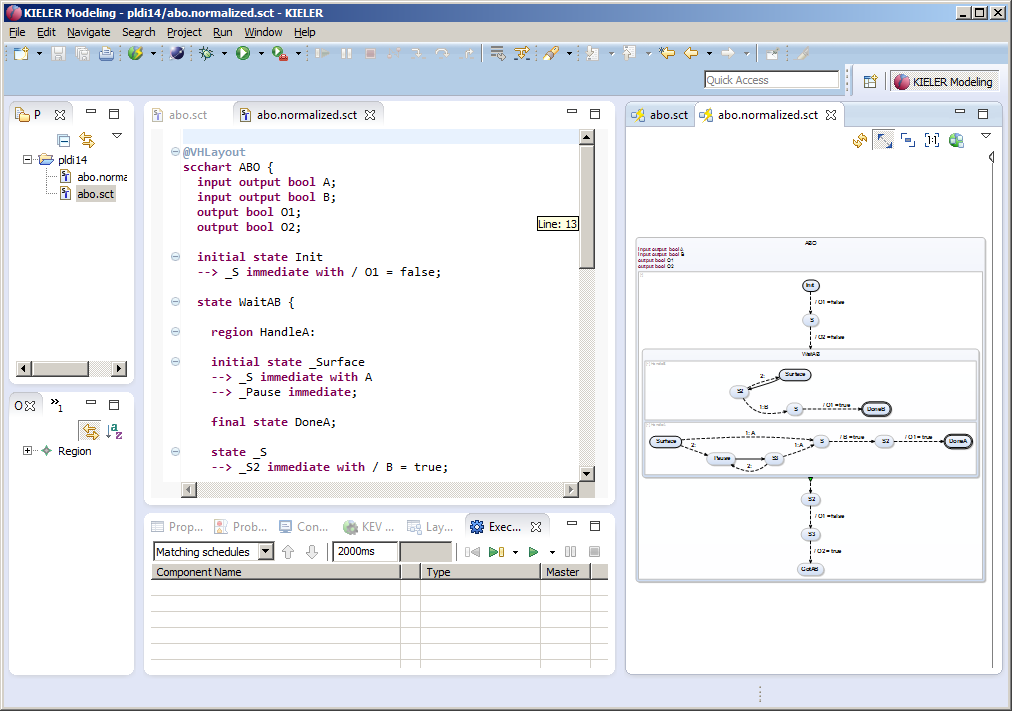
After performing a transformation the transformed SCChart will open (together with it's KLighD diagram visualization):
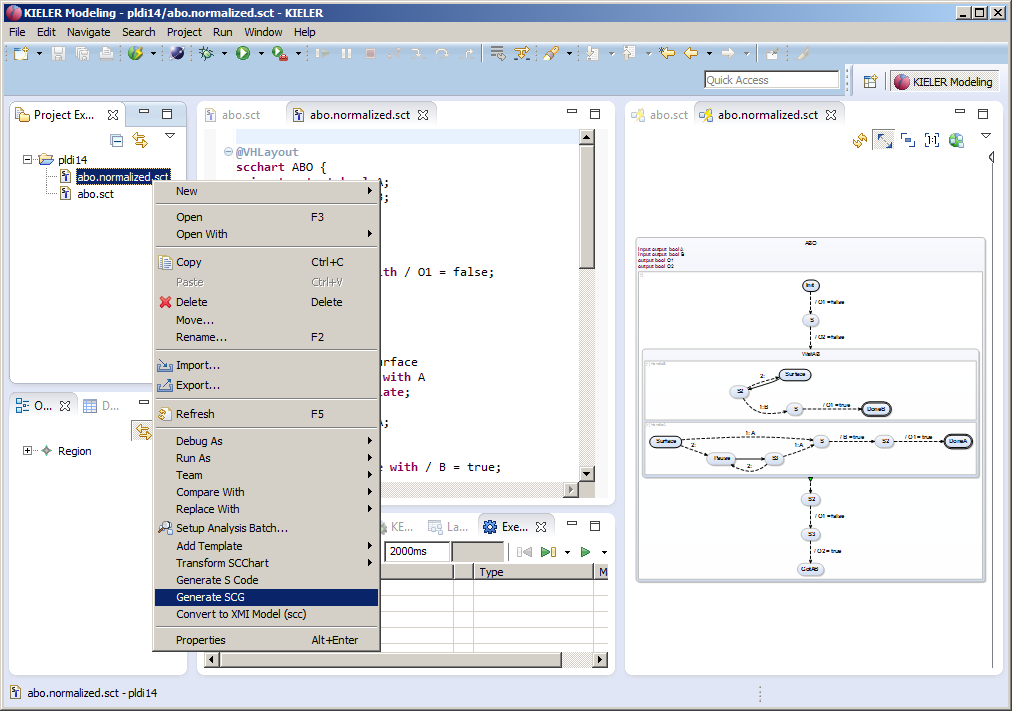
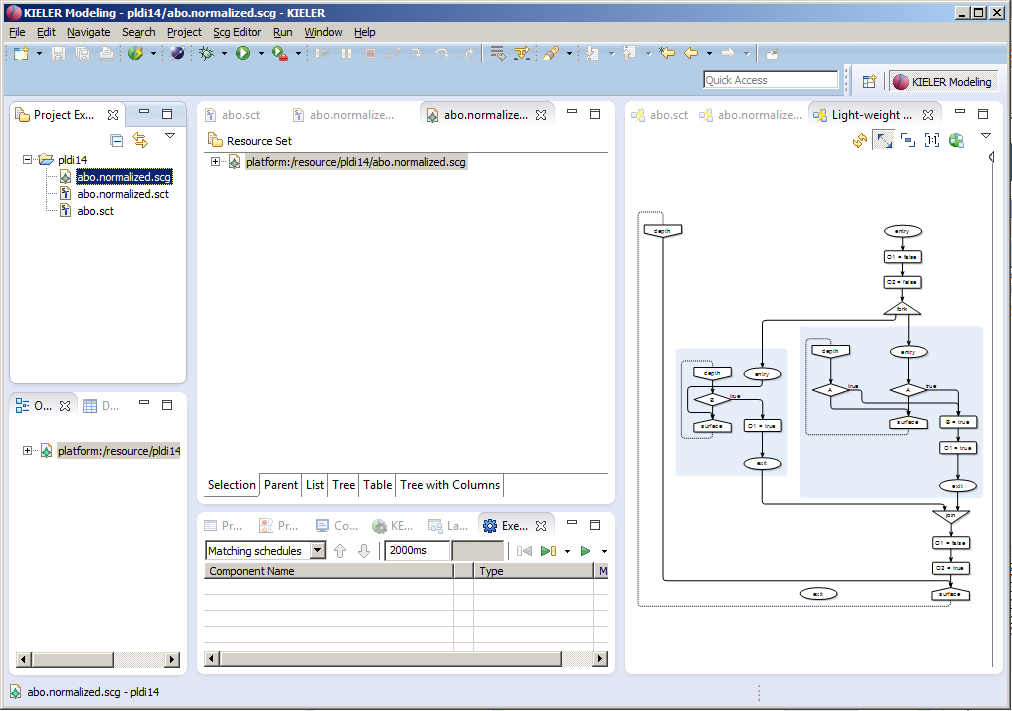
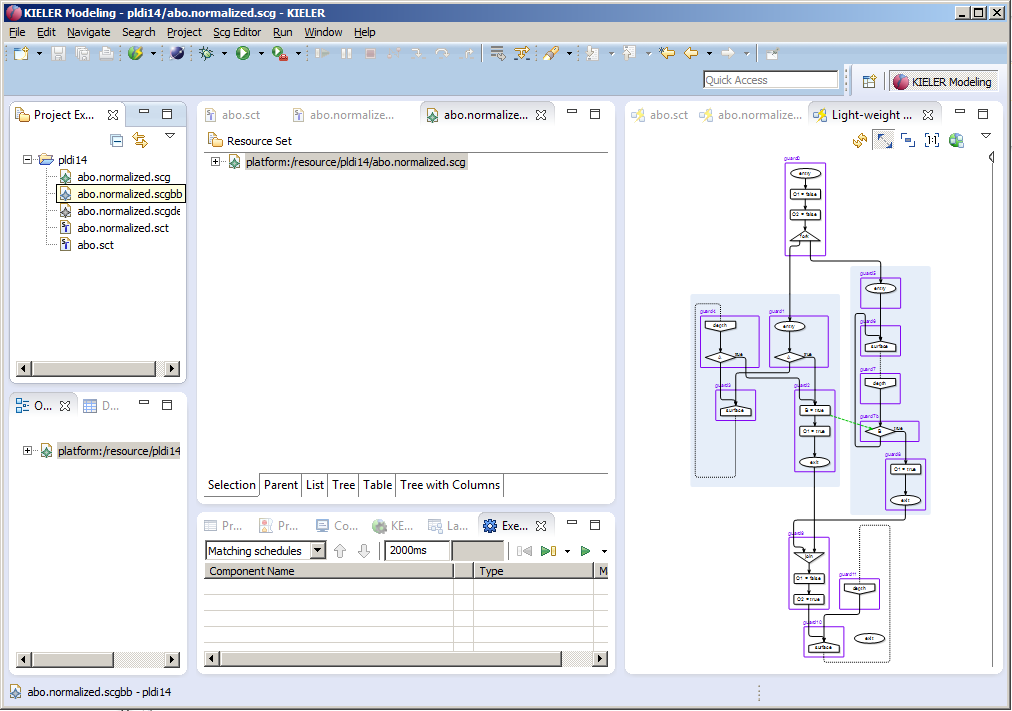
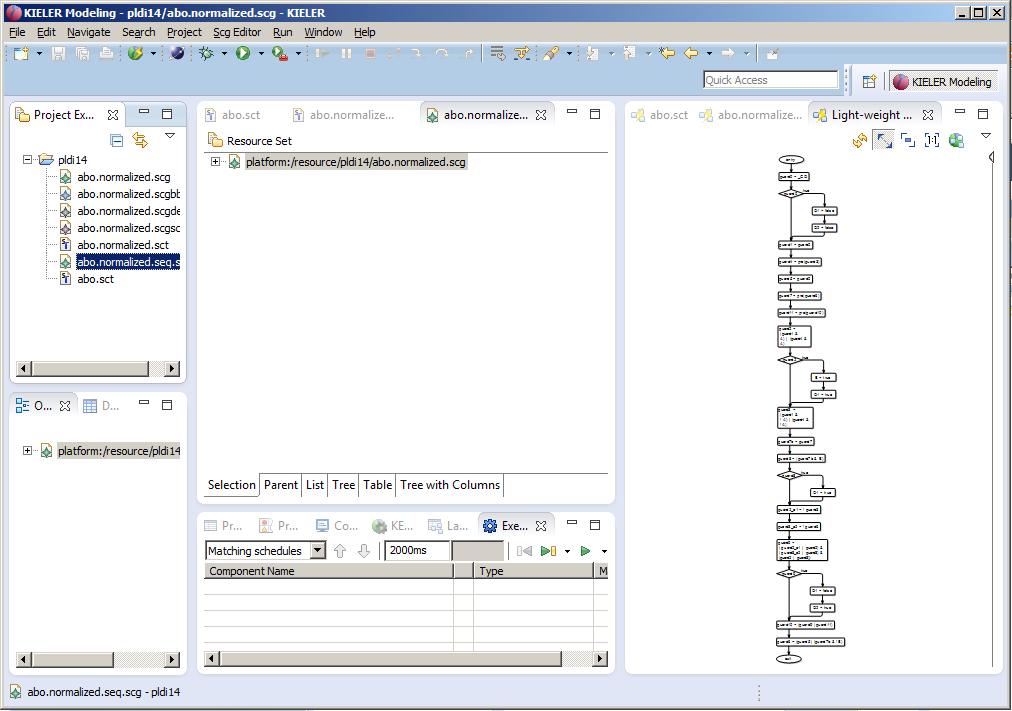
Now generate the Sequentially Constructive Graph (SCG) from the normalized form. You do this also in the context menu of the Project Explorer by selecting the *.normalized.sct and choosing Generate SCG. When selecting the abo.normalized.scg file the SCG diagram will be automatically synthesized (you may also want to re-arrange the KLigD view by dragging in to the right side again).
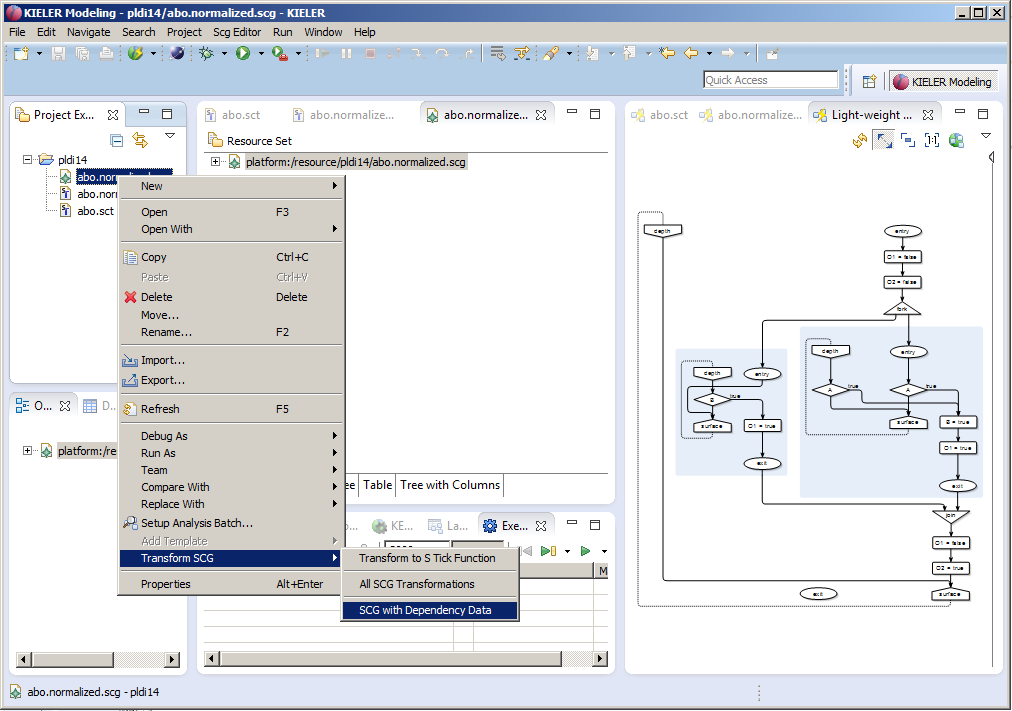
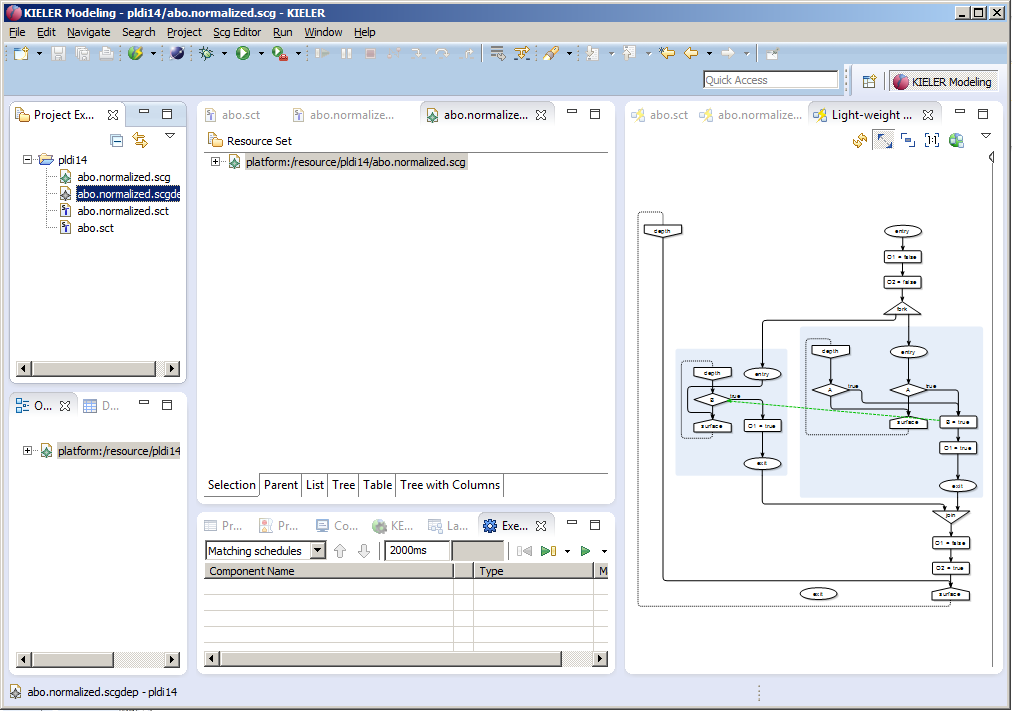
You can now populate the SCG automatically with dependency data. Choose Transform SCG -> SCG with Dependency Data from the context menu (left side). This will result in the following SCG (right side).
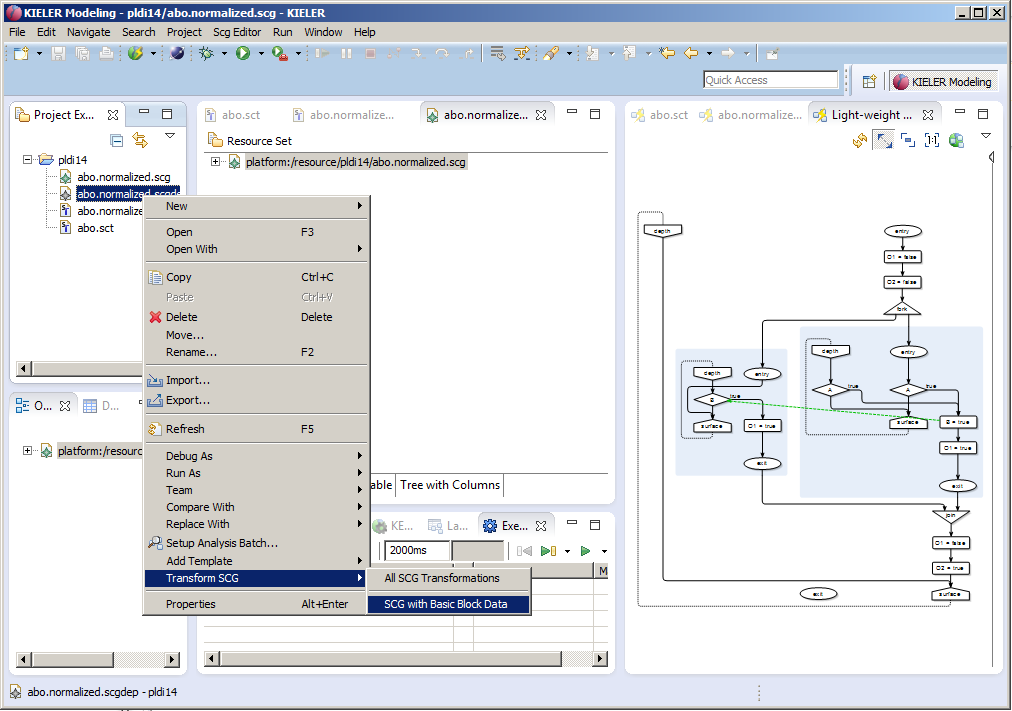
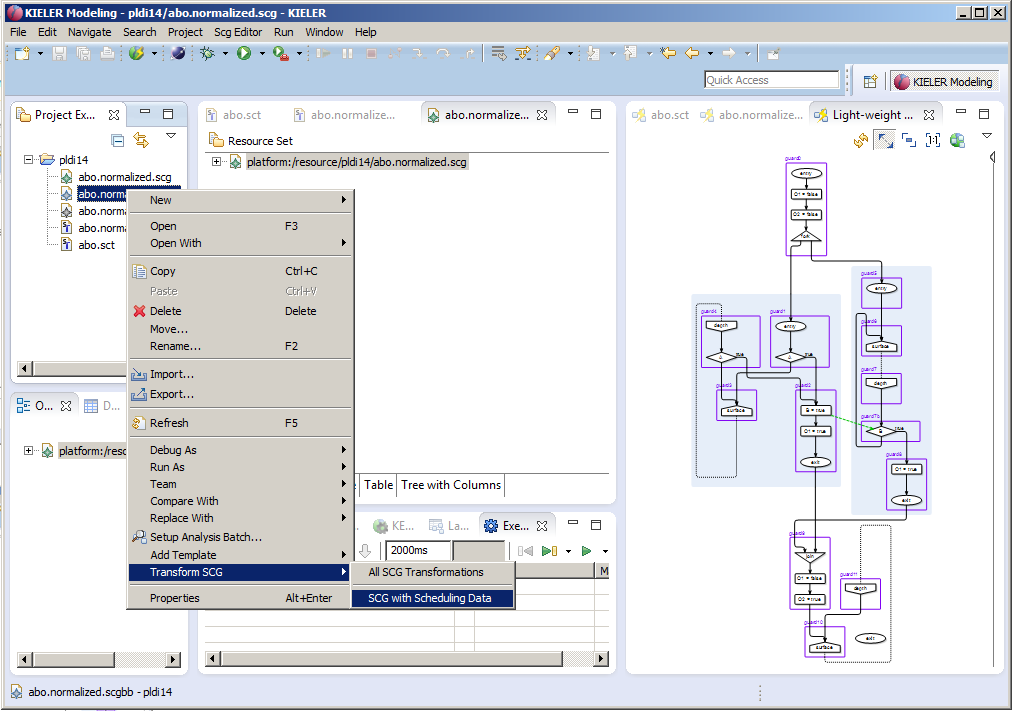
Now populate the SCG with basic block information (left side). The SCG with calculated basic blocks will look like this (right side).
The next step in compilation is the (more fine grained) calculate of scheduling blocks (left side). The populated SCG with scheduling information looks like this (right side).
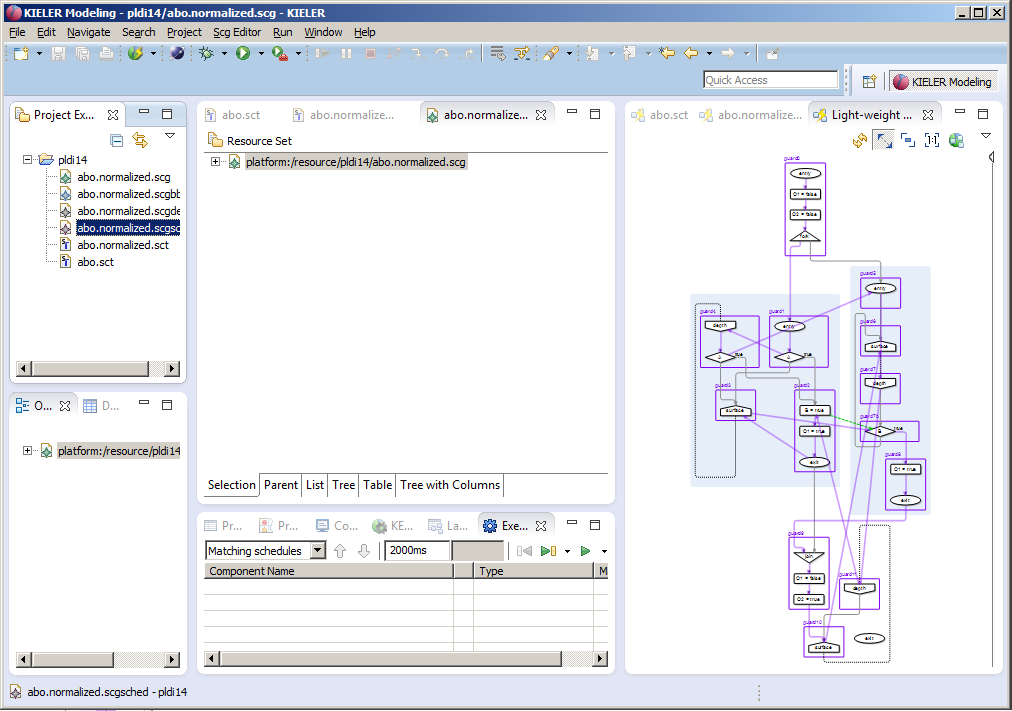
The SCG is now ready to be sequentialized. A primitive scheduler currently is included in KIELER but more elaborate ones are already in the pipe line (left side). The sequentialized SCG looks like this (right side).
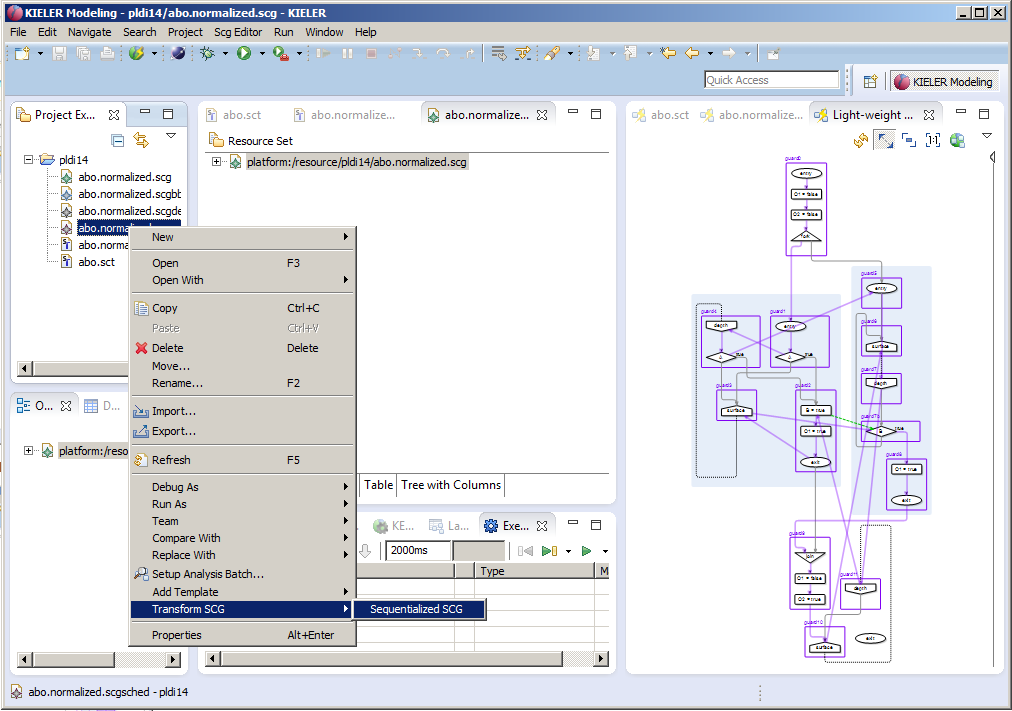
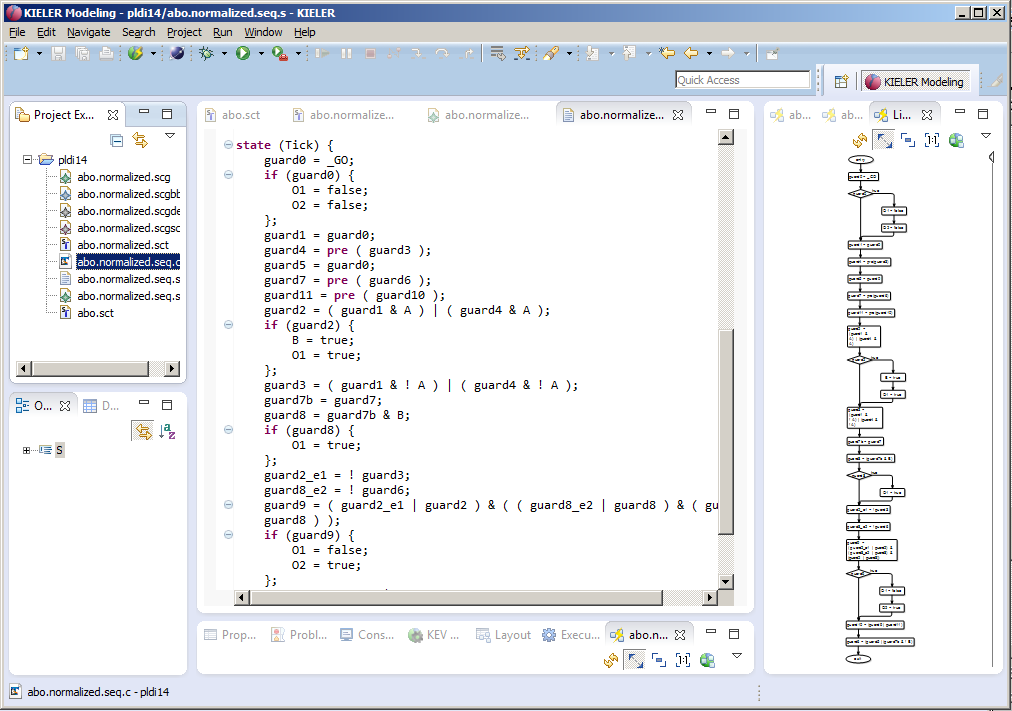
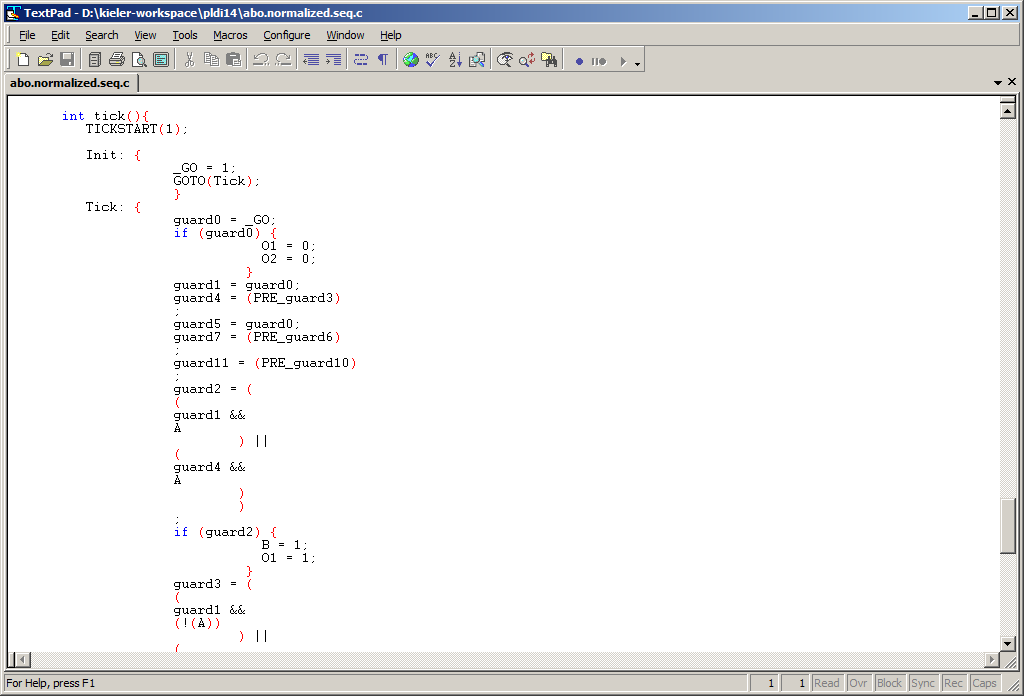
From here its only a short hop to C code. Transform the sequentialized SCG into an S Tick Function (left side). When opening the S file (abo.normalized.seq.s) this already is very c like code (right side).
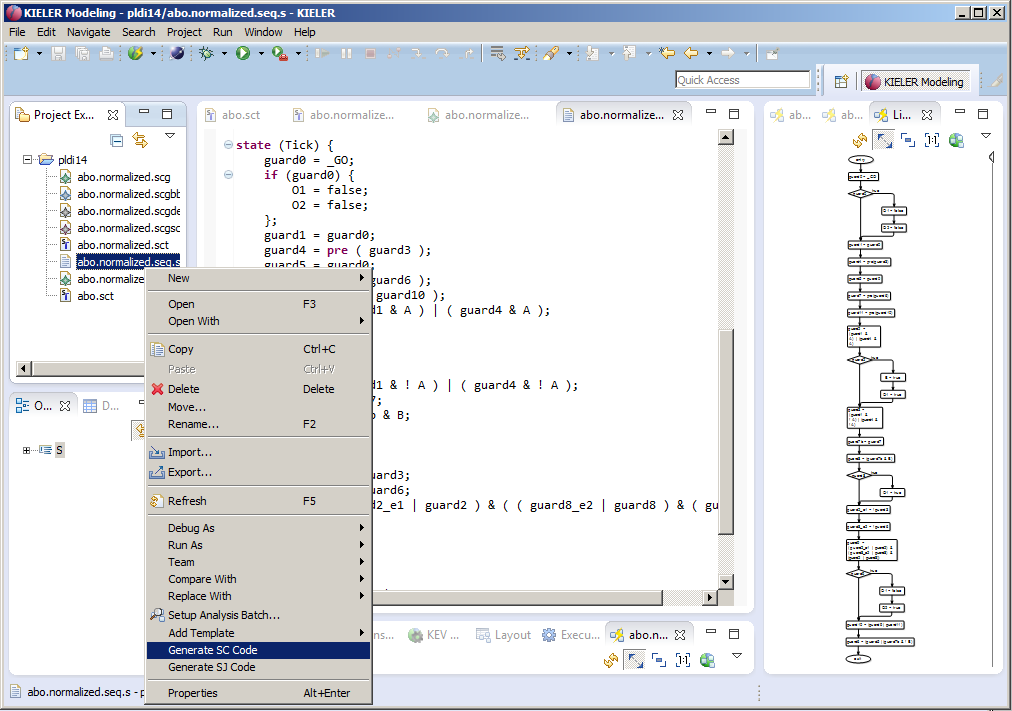
Selecting Generate SC will produce a C file:
3.2 Alternative 2: KIELER Compiler Selection
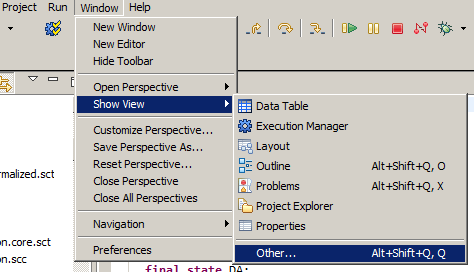
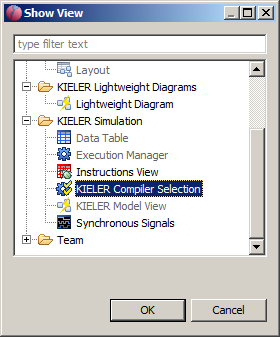
You can also use our new KielerCompiler Selection View (Windows->Show View->Other->KIELER Simulation->KIELER Compiler Selection):
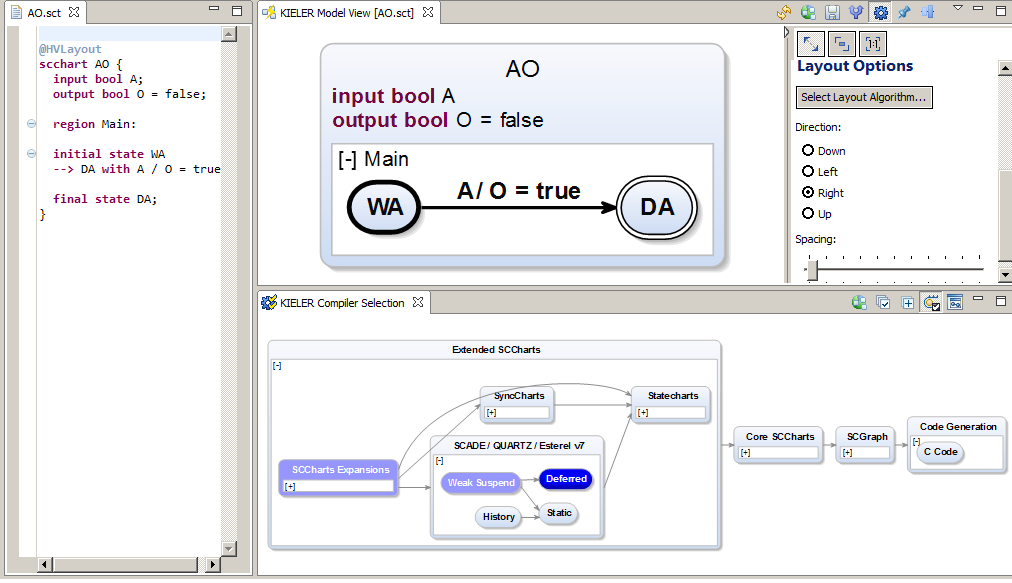
In the KIELER Compiler Selection View you are then able to select the transformations that you would like to be applied to the currently opened model (textual SCT editor). The selected transformations are marked blue. There might be light blue marked transformations that are marked automatically because they are required by the current selected transformation to run BEFORE. You can disable this feature (which is not recommended in most cases but may be suitable for debugging single transformations).
3.3 Alternative 3: Online Compiler / Command Line Compiler
Instead of using the compiler inside the KIELER tool itself you can also use the command line version or use our new SCCharts online compiler.
4. More Examples
Under the following link, you find the examples used for evaluation. Be advised that there currently is no tool integrated evaluation possible. Please refer to the SCCharts superpage for the project status and known limitations. Find the list of Examples used for evaluation here.
Overview
Content Tools